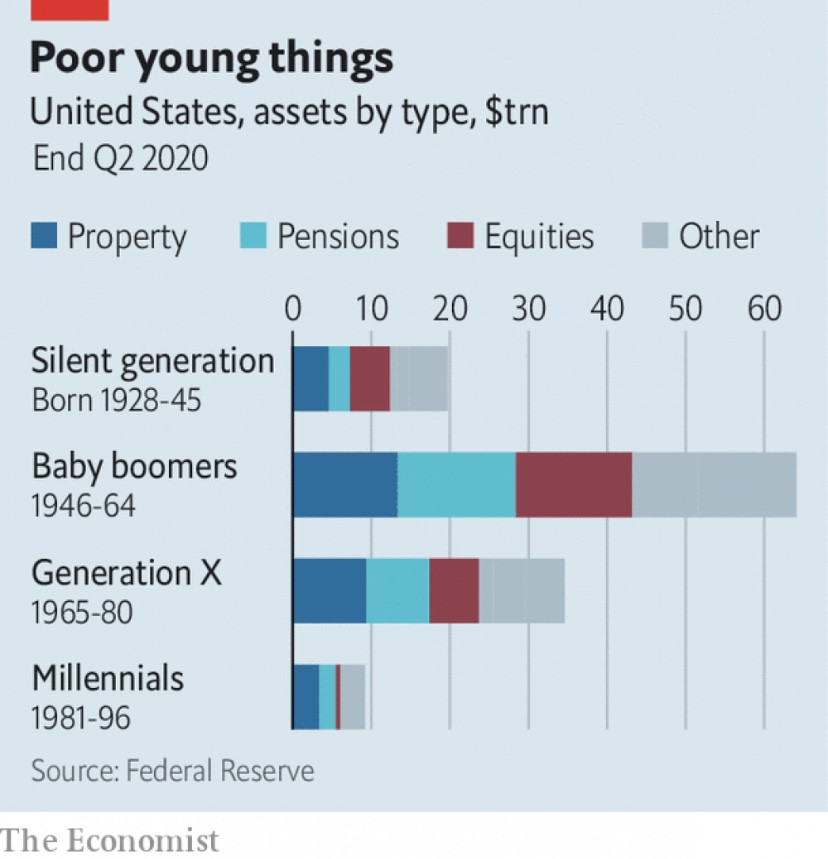
1. Wall Street Will Have To Take Millennial Investors Seriously
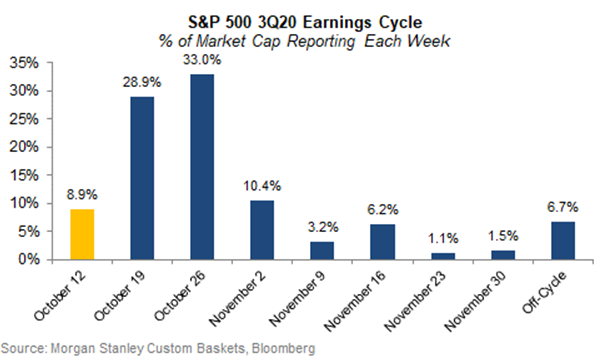
We get Earnings fromNetflix on Tuesday, Tesla and Verizon on Wednesday, and Intel Thursday. Apple, Amazon, Alphabet, Microsoft and Facebook report the following week.—Dave Lutz at Jones Trading
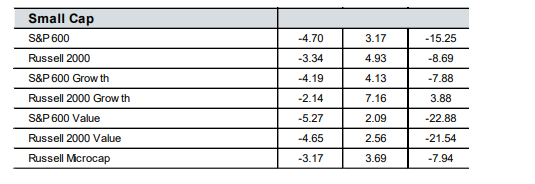
Ted Aronson AJO Hangs It Up……”drought in value is the heart of the challenge”

5 Year small cap value vs. small cap momentum…..DWAS Small Cap Momentum ETF+69%vs. VBR small cap value ETF+18%