1.Technology Sector vs. 1999. 1995-1999 Information Technology Returned 700%
Information technology stocks have rallied 47.8% in the past 12 months, according to FactSet data. But that “still pales in comparison to the Tech Bubble.” Over the past five years, the sector has returned 149%; between 1995 and 1999, the sector returned nearly 700%. Meanwhile, the tech group’s forward price/earnings ratio trades at a 22% premium to the S&P 500 now, on a relative basis, the analysts wrote, below the long-term average of 31%.
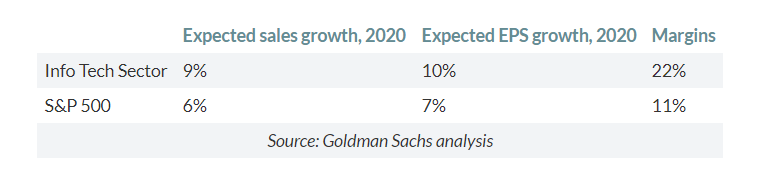
S&P Technology ETF +90% from 2018 XMAS EVE sell off.
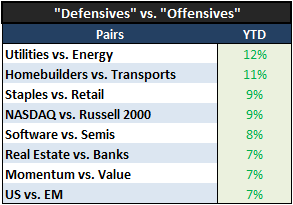
2. Utilities are trading at the highest absolute forward P/E and highest relative P/E to S&P 500 Value over the past 20 years:
Percy Allison
Desk Strategist
Jefferies LLC
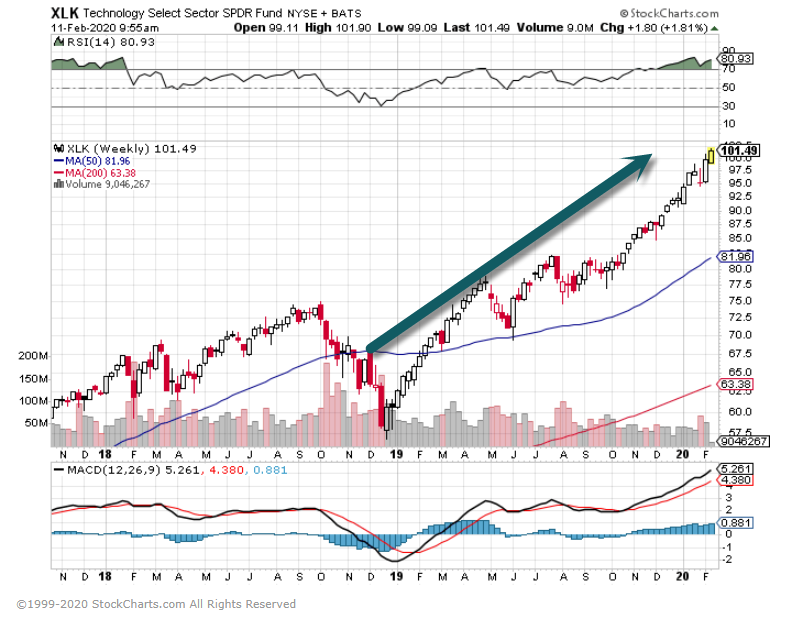
Defensives have steeply outperformed offensives:
Source: Jefferies Trading Desk
Utilities are trading at the highest absolute forward P/E and highest relative P/E to S&P 500 Value over the past 20 years:
Source: Jefferies Trading Desk
3.Coronavirus vs. SARS
- The new coronavirus and SARS come from the same family of viruses that usually infect animals, but can sometimes evolve and spread to humans.
- Investors and analysts often compare the two viruses to gauge the potential economic impact from the latest outbreak.
- The SARS outbreak nearly 20 years ago caused China’s economic growth to slow from 11.1% year over year in the first quarter of 2003 to 9.1% in the following three months.
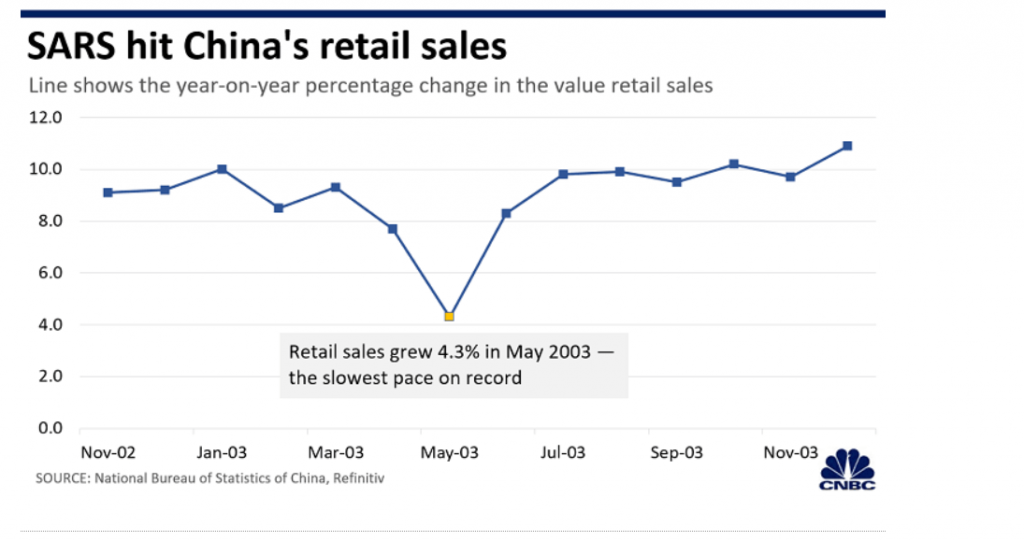
- Growth in retail sales and industri al production in China was also slower around May 2003, but expansion in exports remained steady throughout that year.
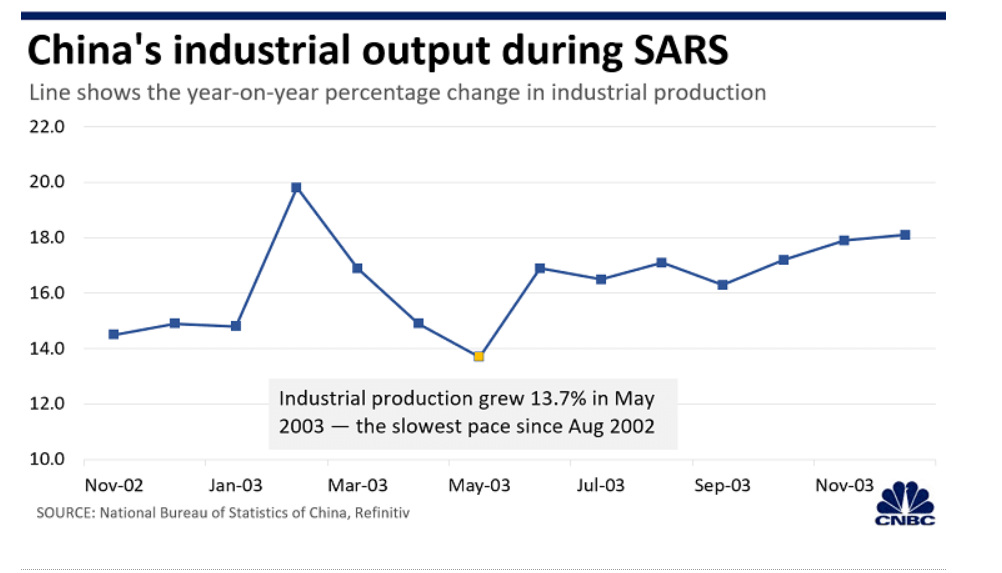
4 charts show how SARS hit China’s economy nearly 20 years ago
Yen Nee Leehttps://www.cnbc.com/2020/02/11/coronavirus-4-charts-show-how-sars-hit-chinas-economy-in-2003.html?__source=sharebar%7Cemail&par=sharebar
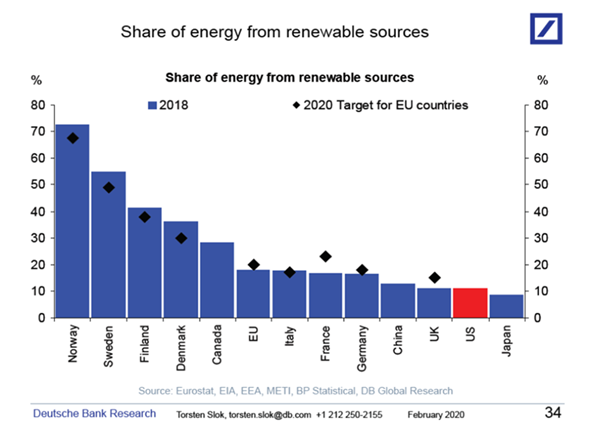
4.The Share of Energy From Renewable Sources 10% in U.S.
Torsten Slok-Deutsche Bank
The share of energy from renewable sources in the US is around 10%, see chart below and here and here.
———————————————–
Let us know if you would like to add a colleague to this distribution list.
5.Inflation Expectations Rolling Over.
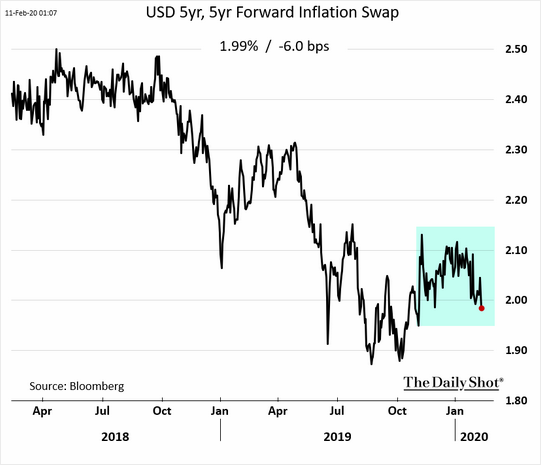
The Daily Shot
6.Two Employment Charts.
Job openings have also rolled over, as you can see in the yellow line in the chart below. On the other hand, openings remain comfortably above the number of unemployed persons in the United States—notwithstanding the aforementioned skills gap problem.
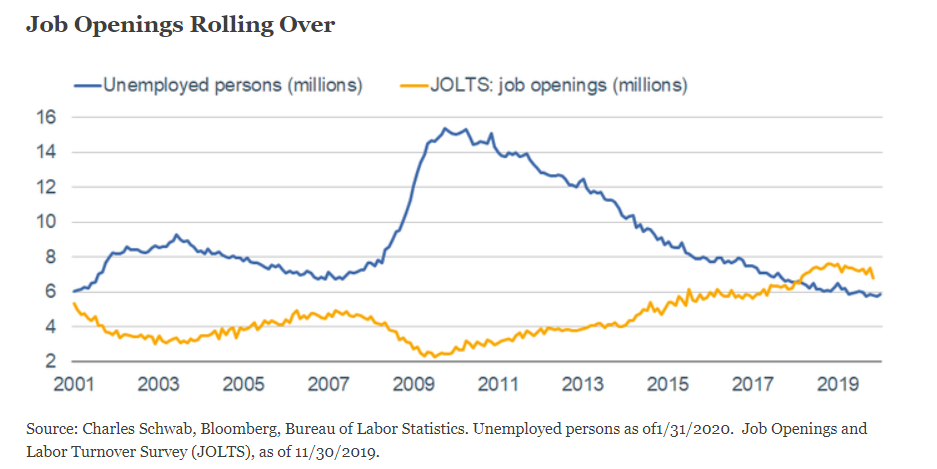
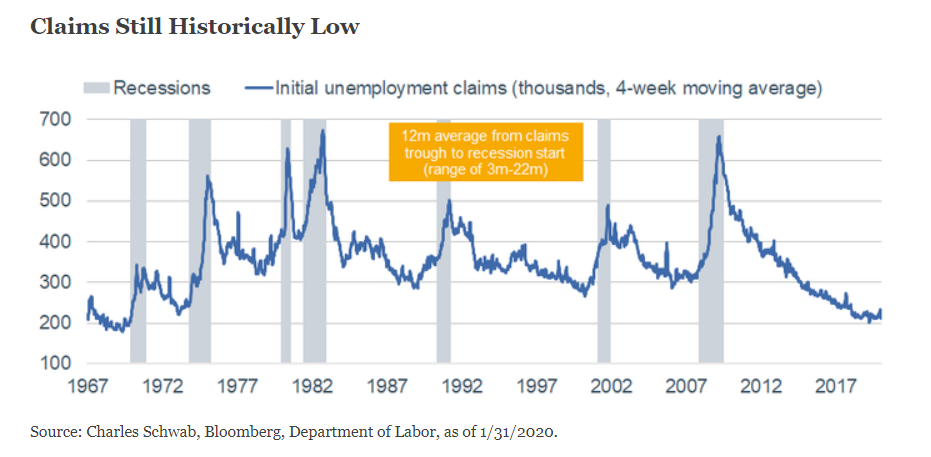
Sleight of Hand: Dissecting the Latest Employment DataBy Liz Ann Sonders
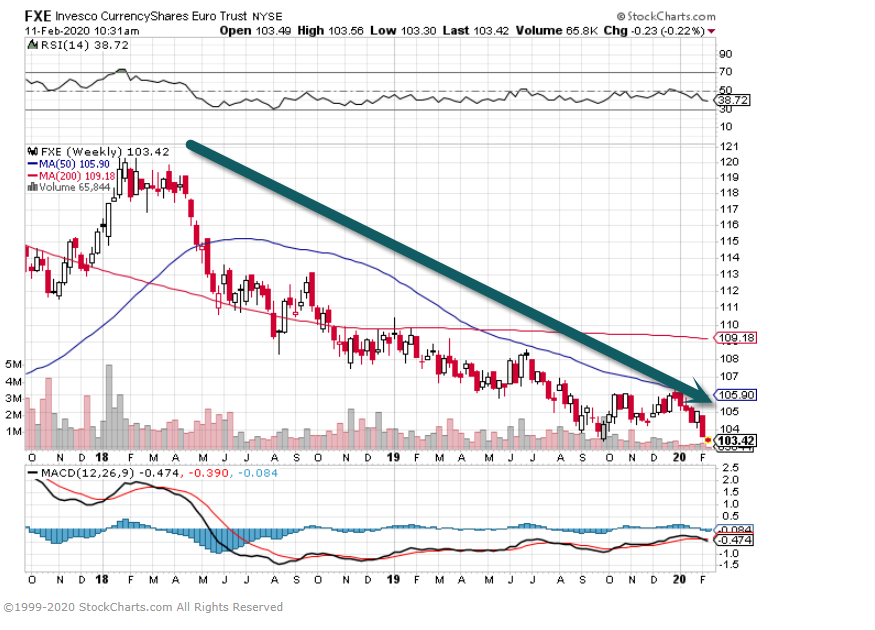
7.EuroCurrency ETF Hits New Lows.
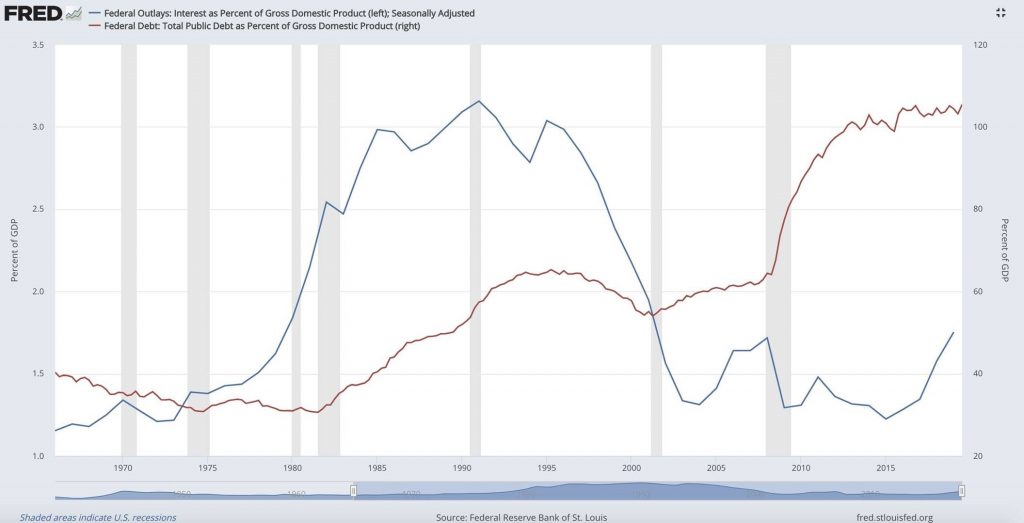
8.Debt AS A % of GDP Less Frightening Than Overall Public Debt
Michael Batnick https://twitter.com/michaelbatnick
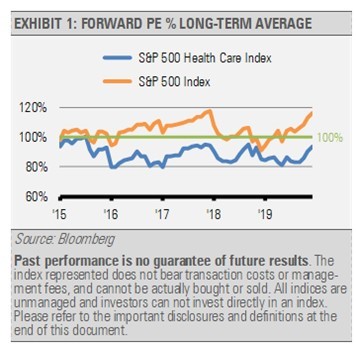
9.Healthcare Sector Trading at Discount to Historical Average
As the graph below illustrates, the S&P 500 Index is trading at a premium (>100%) to its historical average forward price-to-earnings ratio (PE), while the broad health care space trades at a discount (<100%) to its historical average.
https://www.etf.com/sections/etf-strategist-corner/why-health-care-etfs-defense-now
10.The modern business plan
It’s not clear to me why business plans are the way they are, but they’re often misused to obfuscate, bore and show an ability to comply with expectations. If I want the real truth about a business and where it’s going, I’d rather see something else. I’d divide the modern business plan into five sections:
- Truth
- Assertions
- Alternatives
- People
- Money
The truth section describes the world as it is. Footnote if you want to, but tell me about the market you are entering, the needs that already exist, the competitors in your space, technology standards, the way others have succeeded and failed in the past. The more specific the better. The more ground knowledge the better. The more visceral the stories, the better. The point of this section is to be sure that you’re clear about the way you see the world, and that you and I agree on your assumptions. This section isn’t partisan, it takes no positions, it just states how things are.
Truth can take as long as you need to tell it. It can include spreadsheets, market share analysis and anything I need to know about how the world works.
The assertions section is your chance to describe how you’re going to change things. We will do X, and then Y will happen. We will build Z with this much money in this much time. We will present Q to the market and the market will respond by taking this action.
This is the heart of the modern business plan. The only reason to launch a project is to change something, and I want to know what you’re going to do and what impact it’s going to have.
Of course, this section will be incorrect. You will make assertions that won’t pan out. You’ll miss budgets and deadlines and sales. So the alternatives section tells me what you’ll do if that happens. How much flexibility does your product or team have? If your assertions don’t pan out, is it over?
The people section rightly highlights the key element… who is on your team, who is going to join your team. ‘Who’ doesn’t mean their resume, who means their attitudes and abilities and track record in shipping.
And the last section is all about money. How much do you need, how will you spend it, what does cash flow look like, P&Ls, balance sheets, margins and exit strategies.
Your local VC might not like this format, but I’m betting it will help your team think through the hard issues more clearly.
Seth’s Blog