1. Record Stock and Bond Flows…Mass Liquidity.
Wealth of Common Sense Blog For example, Bloomberg’s Eric Balchunas noted this week Vanguard’s S&P 500 ETF (VOO) just broke the all-time record for inflows in a single year: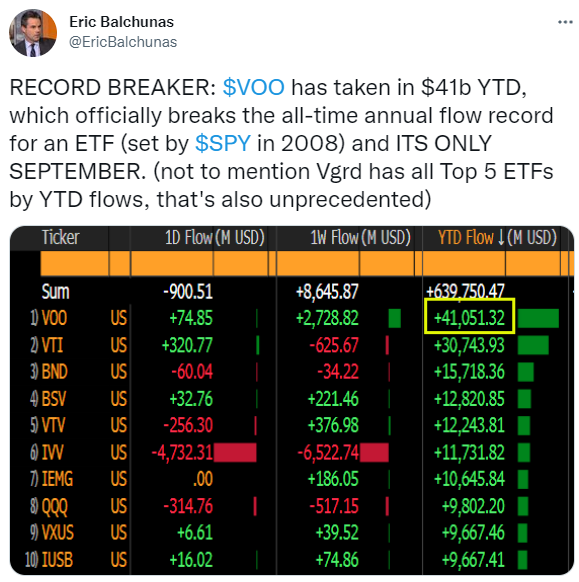
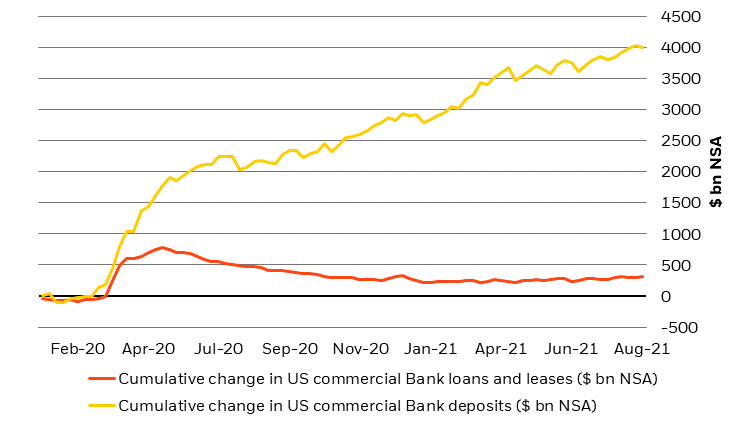
Data from Yardeni Research shows inflows into bond mutual funds and ETFs are as high as they’ve been going back to 2003 by a wide margin:
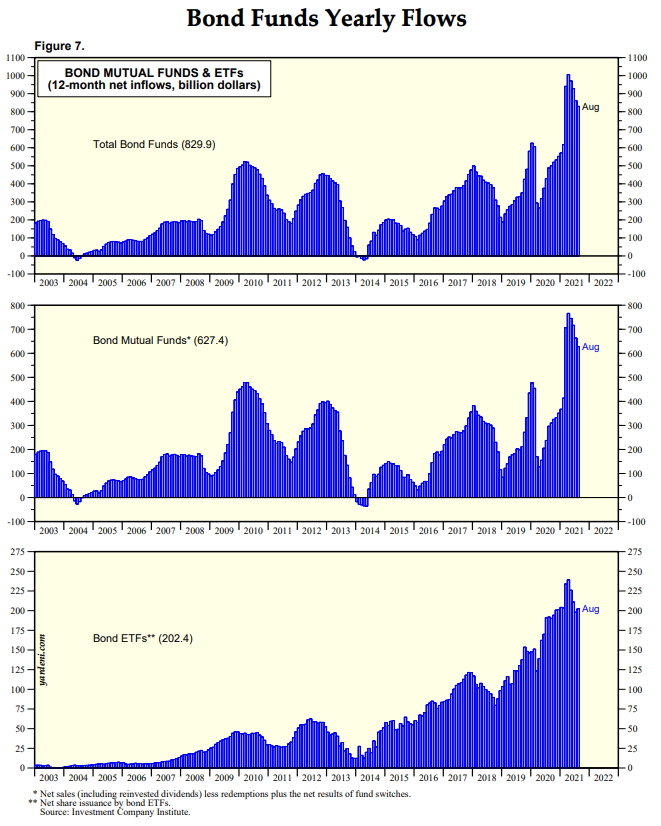
Despite generationally low interest rates, investors continue plowing money into bond funds. According to Yardeni, there was a record $1.01 trillion of inflows into bond funds for the trailing 12 months through April. The 12 month numbers through July and August were close to that record as well.
A Wealth of Common Sense Blog
https://awealthofcommonsense.
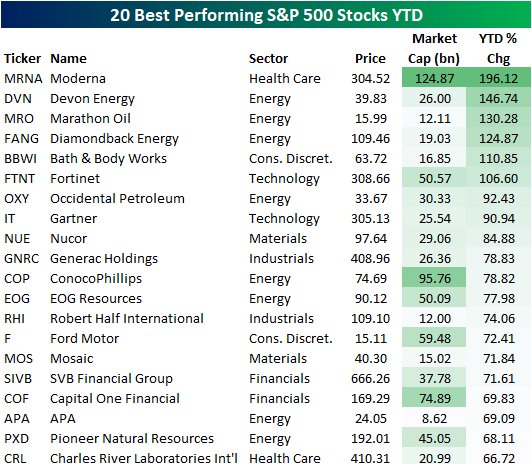
2.Best and Worst Performing S&P 500 Stocks in 2021-Bespoke
The fourth quarter is now off to the races and we thought it worthwhile to check in on the best and worst-performing S&P 500 stocks on a year-to-date basis. As shown below, there are currently six members of the index that have rallied over 100% this year. Apt for the year that its vaccine has rolled out, the biggest gainer of these has been Moderna (MRNA) with a 196.12% rally. It now has a market cap of $124.87 billion versus a market cap of only $41 billion at the start of the year. Of the 20 best performers, MRNA is also the only one with a market cap above $100 billion. The next largest is ConocoPhillips (COP) with a $95.76 billion market cap. COP is one of multiple Energy stocks on this list as well. Of the top 20 performers, Energy sector names dominate the list with 8 members.
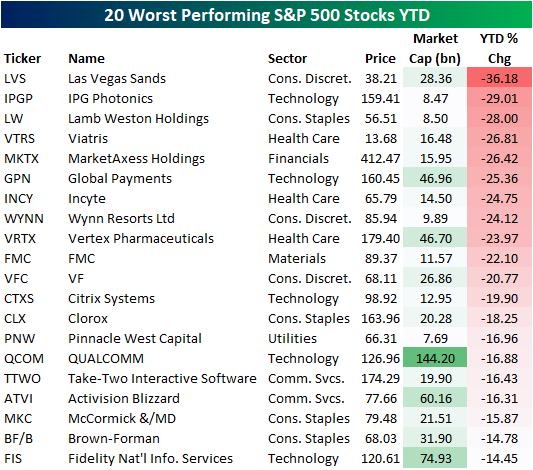
Pivoting to the other end of the spectrum, Las Vegas Sands (LVS) is down the most this year having been cut by 36.18%. IPG Photonics (IPGP), Lamb Weston Holdings (LW), Viatris (VTRS), MarketAxess (MKTX), and Global Payments (GPN) also have fallen by at least 25%. Once again, there is only one member of this list with a market cap above $100 billion: Qualcomm (QCOM). One other interesting factor to note of the worst performers is there are several stocks that were at some point plays on pandemic trends, whether those be reopening or stay at home. For example, in addition to LVS, another gaming/reopening name, Wynn Resorts (WYNN), ranks as the eighth-worst performer YTD. Additionally, strong performers during the onset of the pandemic like Clorox (CLX), Activision Blizzard (ATVI), and Take-Two Interactive (TTWO) are all down double digits this year.
https://www.bespokepremium.com/interactive/posts/think-big-blog/best-and-worst-performing-sp-500-stocks-in-2021
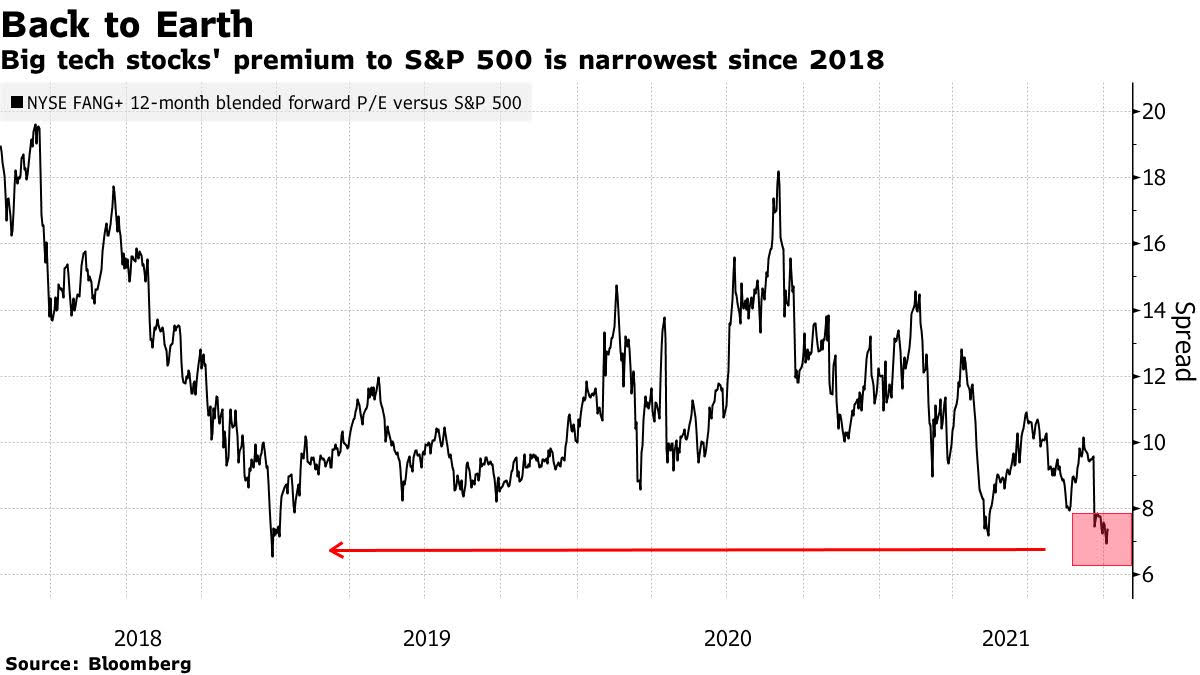
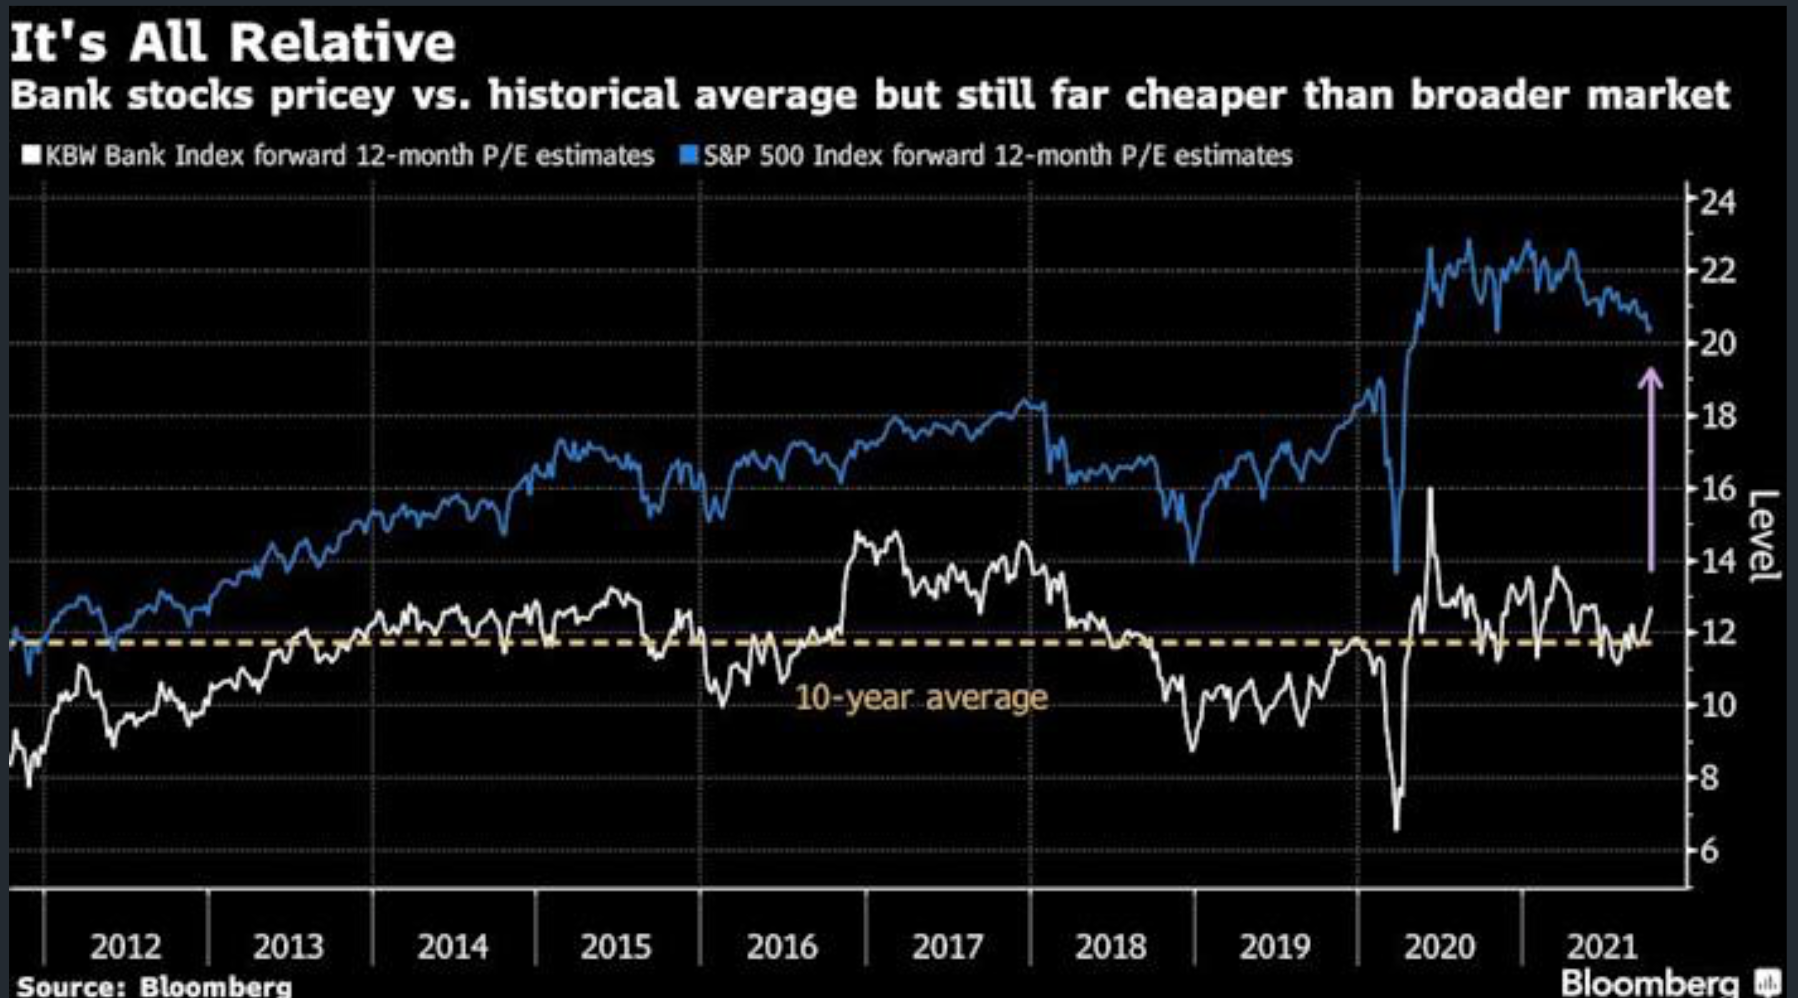
3.Bank Stocks Kick Off Earnings Season This Week
Banks Outperforming this Year but Still Cheap vs. S&P
https://finance.yahoo.com/news/u-bank-stocks-may-too-113126241.html
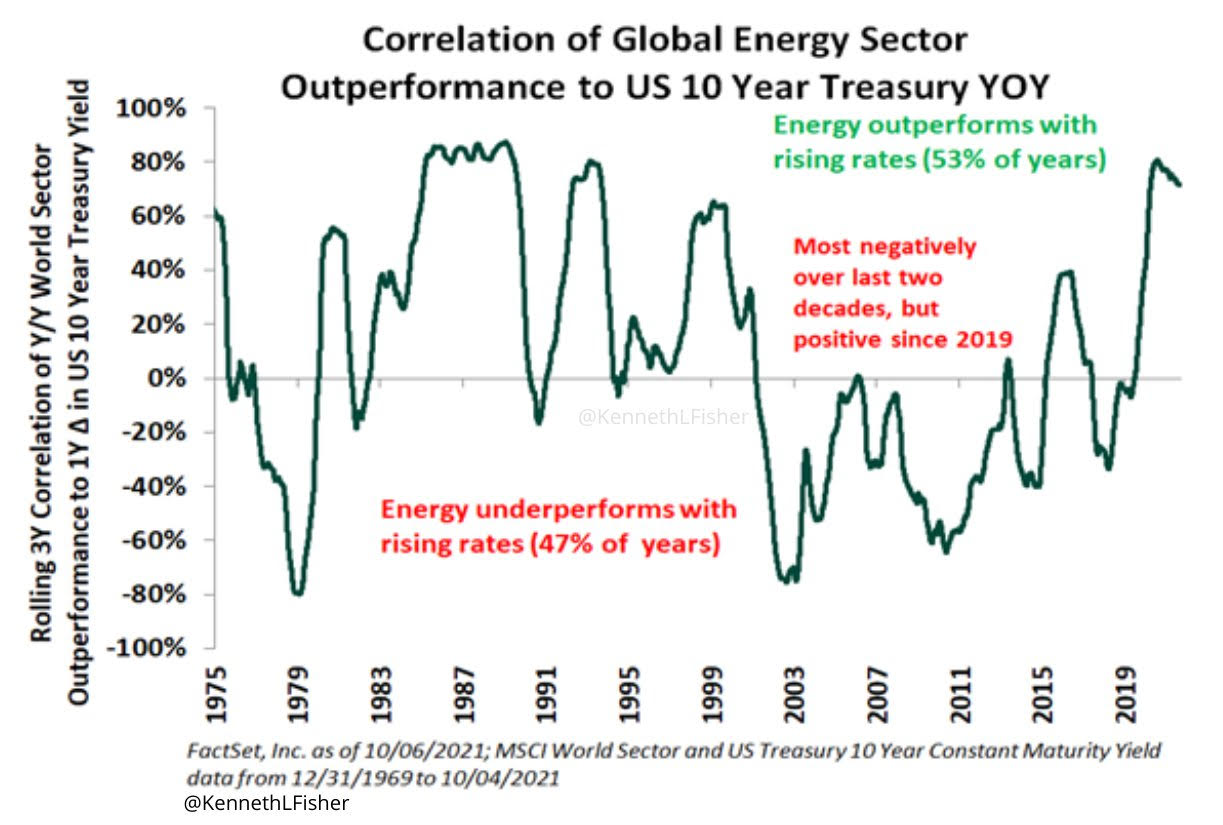
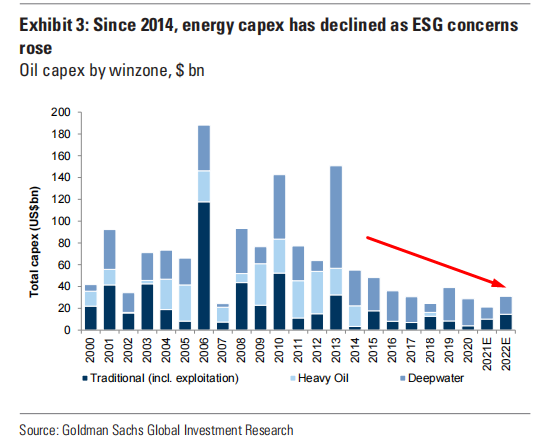
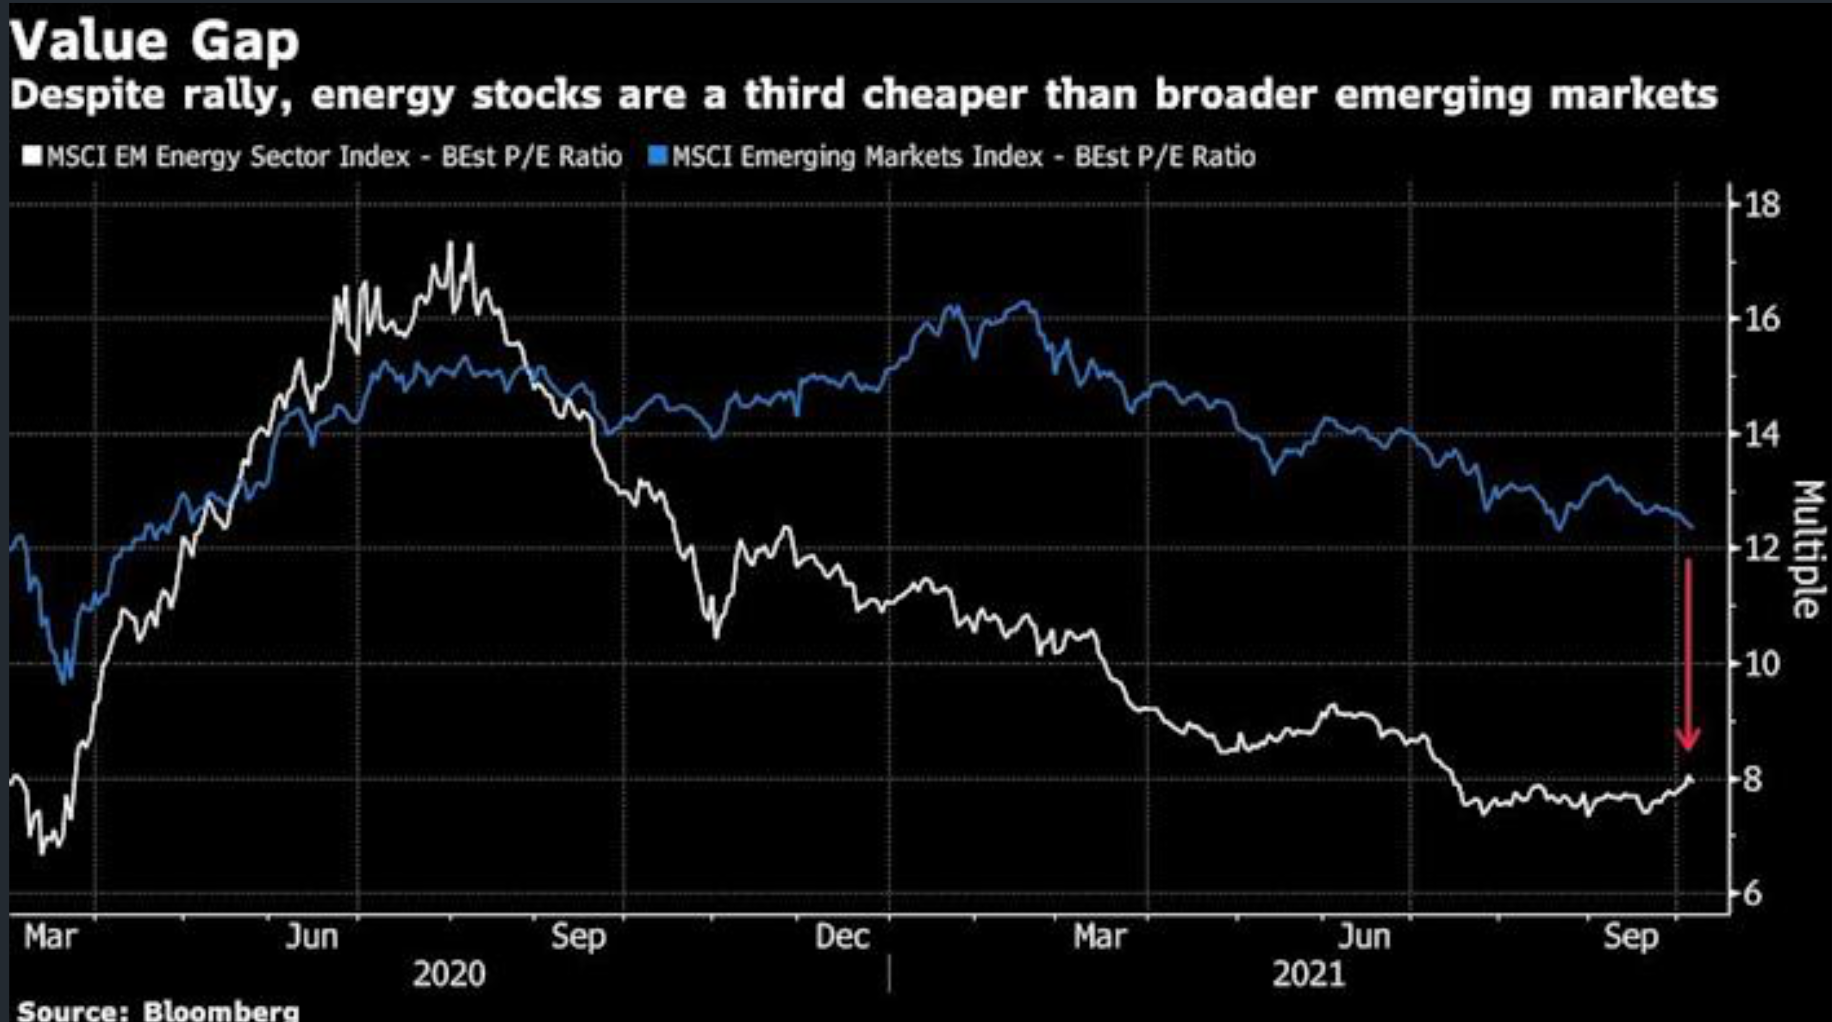
4. Emerging Market Energy Sector Cheap vs. Broad Market.
Another Sector with good run but still fundamentally cheap
https://finance.yahoo.com/news/world-energy-chaos-turns-russia-160100835.html
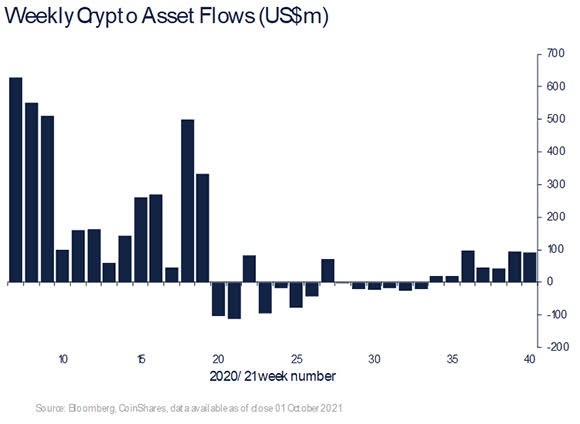
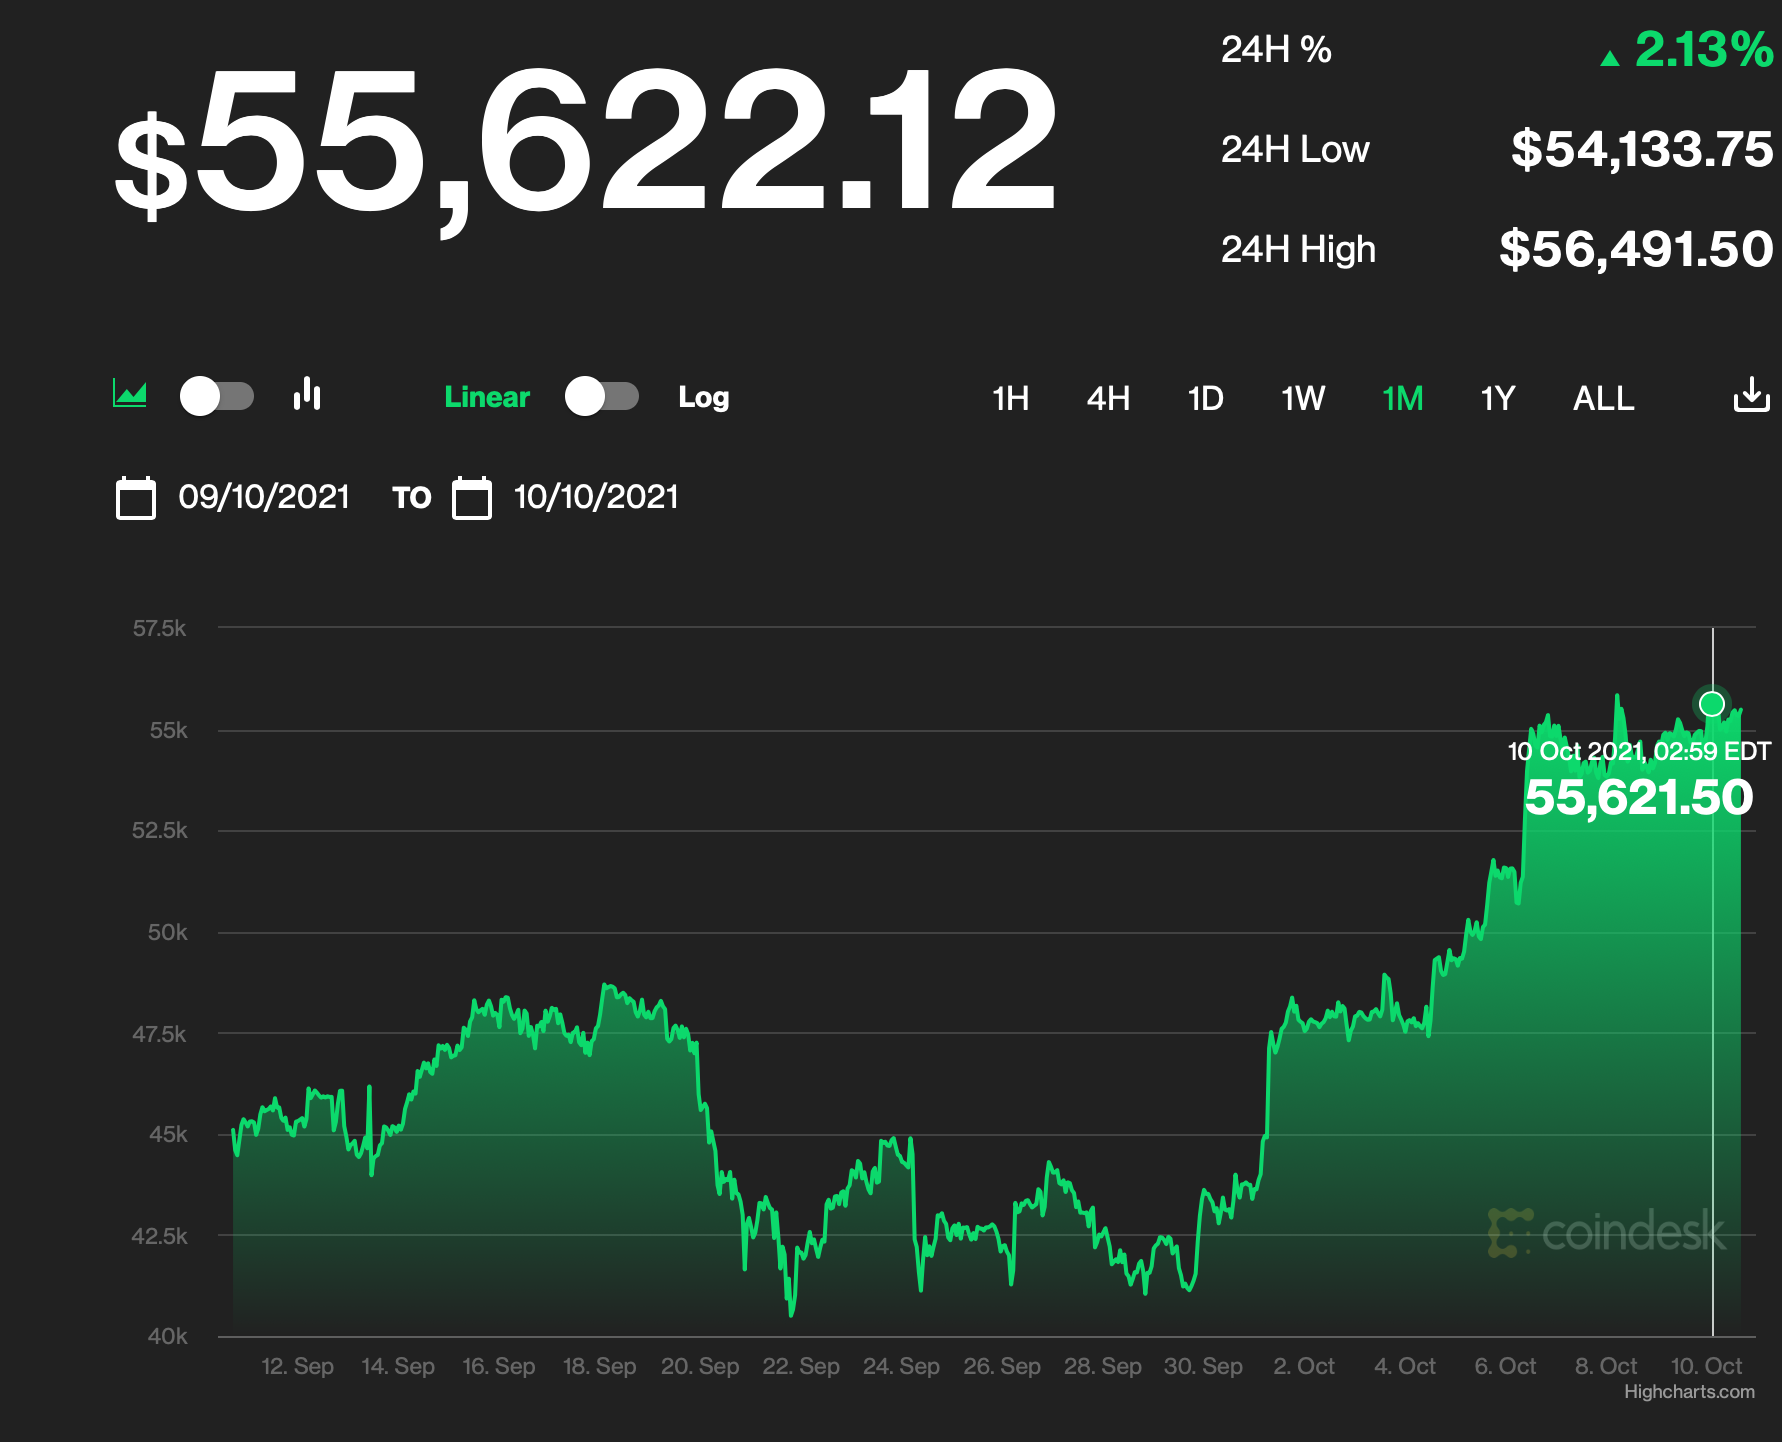
5. Bitcoin +14% for the Week….Mystery Whale Buys $1.6B Wed. Trade.
Bitcoin One Month Chart
Who Bought $1.6B in Bitcoin Wednesday, and Why? Coindesk
Where? Trying to pin down the exchange that took on this trade offers some hints about the buyer’s motivation.
The price of bitcoin on Coinbase relative to other exchanges rose sharply as the trade was underway, leading some to speculate that the regulated U.S. exchange was the platform where the transaction happened. However, a little more digging into the data places the trade in Asia.
Three exchanges saw particularly large volumes in their perpetual futures contracts, according to Ki Young Ju, CEO of data provider CryptoQuant. Those three – Binance, Huobi and ByBit – while not technically based in China, have long had ties to the country, where yet another crackdown on crypto was recently announced.
Bitcoin perpetual futures trading volume, Oct. 6, 2021 (CryptoQuant)
“Whales bought up $BTC in the perpetual futures markets yesterday mostly at @binance, @HuobiGlobal and @Bybit_Official. Basis ratio says it was futures-driven, and they punted long positions as open interest skyrocketed at that time. These guys know something,” Ki tweeted Thursday.
Ki hypothesized that one possible explanation could be traders taking on huge positions ahead of a rumored approval by the U.S. Securities and Exchange Commission of a futures-based bitcoin exchange-traded fund (ETF). The buzz hit the market after the regulator’s chairman, Gary Gensler, merely reiterated his previously stated preference for a futures-based ETF should one ever get launched.
“If this move was the ETF front-running from US whales, they are likely to use non-US exchanges to avoid blame for insider trading IMO,” Ki tweeted, shooting down the idea that the trade came from an order on Coinbase. “Spot trading volume dominance for Coinbase is increasing lately, but not that high compared to early this year.”
Again, that doesn’t explain the trader’s willingness to accept slippage. After all, front-running a regulatory action a full week after speculation began by piling all in with one big order wouldn’t be prudent or rational. That doesn’t mean irrational exuberance doesn’t exist in crypto markets; for many participants it’s a feature, not a bug. But that’s not something usually characteristic of an entity with the resources to take on a billion-dollar trade.
Rather, the fact these three perpetual futures exchanges originated in China (though no longer based there) may be more significant than just their relative liquidity.
https://www.coindesk.com/
6. Dividend Growers Vs. High Yield Bonds
Equities: Dividend growers tend to outperform high-yield bonds during times of stress.
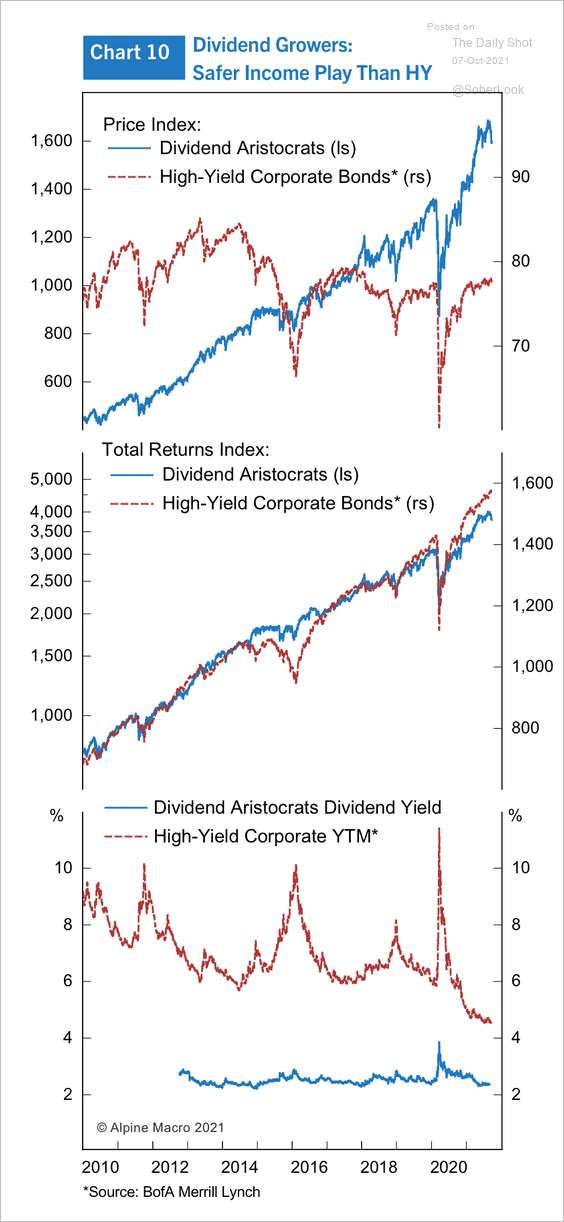
The Daily Shot Blog https://dailyshotbrief.com/
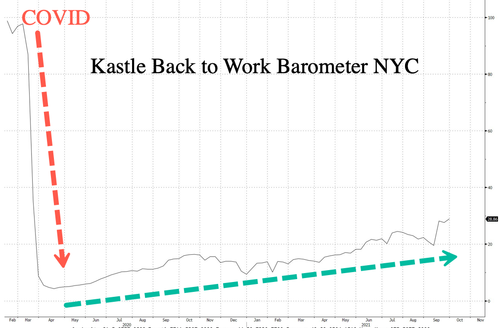
7. NYC-Apartment Rents and Home Prices Booming but Retail 30% Occupancy ….Office Buildings Only Back to 29% Capacity.
Zerohedge–Some of the busiest streets in midtown Manhattan are plagued with vacant storefronts as a drop in tourism and office workers have severely punished the retail industry during the pandemic.
A new report released Thursday from the Real Estate Board of New York outlines how 30% of 311 storefronts in retail areas around Midtown East and Grand Central are vacant, which is more than double the historical rate. The report also said Madison Avenue had a retail vacancy rate of 28% among 289 stores.
Kastle Systems, whose electronic access systems secure thousands of office buildings across NYC, showed that only 29% of workers were back at their desks in late September.
8. The New Buzzword “Stagflation”
More than 4,000 stories mentioned the word “#stagflation” in September, 2X as many as in August, itself a record high going back to 2012
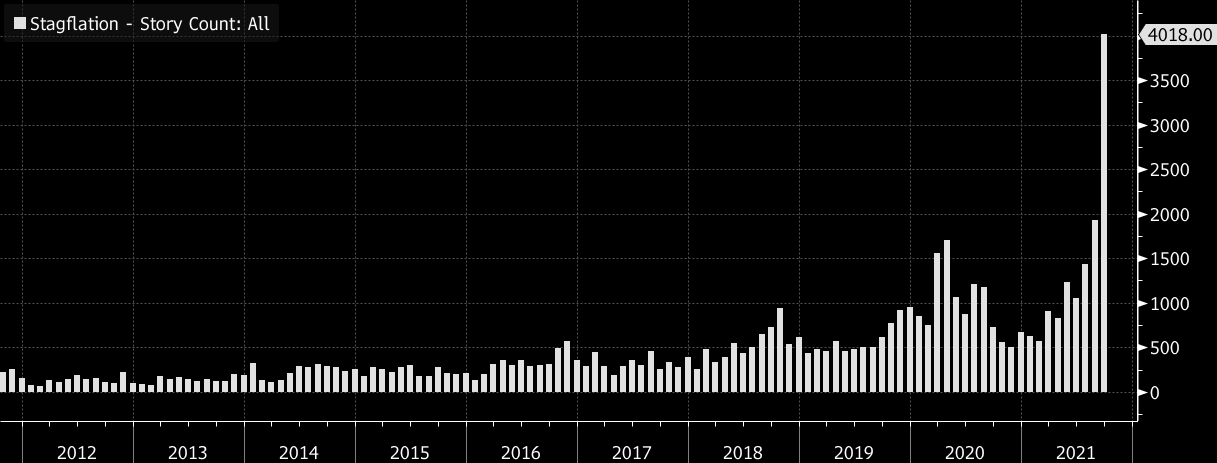
Barry Ritholtz The Big Picture
https://ritholtz.com/2021/10/
9. A Harvard nutritionist and brain expert shares the 5 foods she eats every day to sharpen her memory and focus
Published Fri, Oct 8 202112:07 PM EDTUpdated Fri, Oct 8 202112:30 PM EDT
As a dietitian, I always tell people to think of the brain as the mastermind behind almost everything — our thoughts, memory, focus, movements, breathing, heartbeat — and that certain foods can help make it stronger, sharper and smarter.
Our brain and diet also play a key role in longevity. According to the National Institute on Aging, what we eat can directly impact inflammation and oxidative stress in our bodies — both of which can affect our risk of neurodegenerative diseases, including Alzheimer’s and Parkinson’s.
I spoke with Dr. Uma Naidoo, a nutritional psychiatrist, faculty member at Harvard Medical School and author of “This Is Your Brain on Food,” about what she eats to sharpen her memory, focus and overall brain health:
1. Extra dark chocolate

Chopped dark chocolate
Julia Malynovska | Twenty20
“Extra dark chocolate is full of antioxidants and cacao flavanols that help preserve the health of brain cells,” Naidoo tells CNBC Make It. “It also contains fiber to help reduce brain inflammation and prevent cognitive decline.”
A 2020 study looked at how dark chocolate and white chocolate can affect the memory of healthy young adults. Participants who were given dark chocolate had better verbal memory performances two hours after consuming the chocolate, compared to the group that received white chocolate.
Researchers suggested this was due to the higher flavonoid content of the dark chocolate, “which can acutely improve cognitive function in humans.”
Extra dark chocolate should be at least 70% cacao or greater, according to Naidoo.
Just don’t go overboard with the serving sizes, she says: “One meta-analysis suggests that the optimal amount of dark chocolate consumption for the health of our blood vessels — including the ones that supply blood to the brain — is about 45 grams per week.”
2. Berries
Fresh berries
Viktoryia Vinnikava | Twenty20
“Berries are packed with antioxidants, phytonutrients, fiber, vitamins and minerals,” says Naidoo. “These nutrients help retain memory, and the fiber content helps feed microbes in the gut to reduce brain inflammation.”
She suggests choosing from an assortment of red, blue and black-colored berries. Strawberries, for example, are rich in flavonoids and may help slow down cognitive decline; blueberries contain different types of flavonoids linked with preventing oxidative stress; and blackberries are great sources of antioxidants, which help brain cell health.
“Eating a variety of colorful berries can also reduce symptoms of anxiety and help fend off neurodegenerative diseases like dementia,” says Naidoo.
She typically goes for a half or single cup in her daily serving.
3. Turmeric (with black pepper)
One of the major ingredients in curry powder, turmeric contains a compound called curcumin, which is the secret behind its brain-boosting benefits.
“Curcumin is a powerful anti-inflammatory substance,” says Naidoo. “Consuming it, studies have found, can help reduce symptoms of anxiety and lower cognitive decline with age.”
Turmeric is good solo, but the benefits can be stronger when combined with black pepper. Naidoo always adds “a pinch of black pepper in turmeric because piperine — the compound in black pepper — activates the curcumin and increases the bioavailability to the brain and the body.”
You can incorporate turmeric and black pepper into your diet by adding it to a hearty rice dish, a side of potatoes, a golden milk latte or some oatmeal.
4. Leafy Greens
Plate of spinach
Ekaterina Budinovskya | Twenty20
“Leafy greens are a staple in brain-healthy diets because they contain folate, which is a B vitamin that supports neurodevelopment and neurotransmitter function,” explains Naidoo. “Folate deficiency has been tied to increased symptoms of depression as well as cognitive aging.”
Naidoo says her favorite leafy greens include:
- Arugula
- Dandelion greens
- Spinach
- Swiss chard
- Watercress
Not a salad fan? You can also enjoy them as creative ingredients in your favorite dishes, like pasta, burritos or as a pizza topping.
5. Fermented foods
Yogurt bowl
David Tanke | Twenty20
Fermentation involves adding foods to a culture of microorganisms that then feed on the sugars in the food. This creates other products, such as lactic acid, that can generate gut-friendly bacteria.
“We have what’s called a gut-brain connection,” says Naidoo. “So when we eat fermented foods and boost our gut health, we may also improve our cognitive function.”
She likes to eat homemade kimchi as a snack with celery sticks, or combine it with salads for extra texture and flavor. Some other fermented foods Naidoo recommends:
- Sauerkraut
- Miso
- Kombucha
- Kefir
- Yogurt
However, large amounts of fermented foods can make you bloated. “If you feel uncomfortable, cut back on your intake until your gut and body adjust,” Naidoo advises.
You’ll also want to double-check the food labels to ensure that what you’re buying is actually fermented. Typically, you’ll see a label that mentions “live active cultures.”
Lauren Armstrong is a dietitian and nutrition coach. She was also a nutritionist for The Women, Infant and Children (WIC) program. Lauren received her bachelor’s degree in dietetics from Western Michigan University and has written for several publications, including Livestrong and Healt
10. Nothing Get in the Way of Success Like Avoidance
Tiny Thought
There is nothing that gets in the way of success more than avoidance. We avoid hard conversations. We avoid certain people. We avoid hard decisions. We avoid evidence that contradicts what we think. We avoid starting a project until we’re certain of the outcome.
To justify our avoidance, we lie to ourselves. We tell ourselves that we’re noble — we don’t want to hurt someone’s feelings. We tell ourselves we don’t want to offend others. We tell ourselves that things will get better. We tell ourselves that things will get easier. We tell ourselves that we can avoid the real issue without any impact. We tell ourselves we’ll start when the time is right.
Sometimes we muster up half the courage. We have half the conversation we wanted to have. We do half the hard thing. We acknowledge the evidence but convince ourselves this time is different. We see the person we’re avoiding but don’t really talk to them. We start but don’t commit to the project.
And here’s the interesting thing. Half-efforts tend to make things worse, not better. When things don’t get better, it only reinforces that we shouldn’t have said anything in the first place. Avoiding isn’t better, it’s just easier.
Not only does avoiding today make the future harder, but it also almost always makes the present harder. Avoiding puts you on a hair-trigger, anything will set you off. We all do this. Who hasn’t entirely avoided a hard conversation with their partner about something only to find themselves in an insignificant argument over something trivial? Of course, the petty fight isn’t about the trivial thing, it’s about avoidance of the hard thing.
Everything becomes harder until we stop avoiding what’s getting in the way. The longer you wait the higher the cost.
Farnum Street