1. For What It’s Worth – These 2 will Not Cause the End of the Bull Market-Quarterly Letter

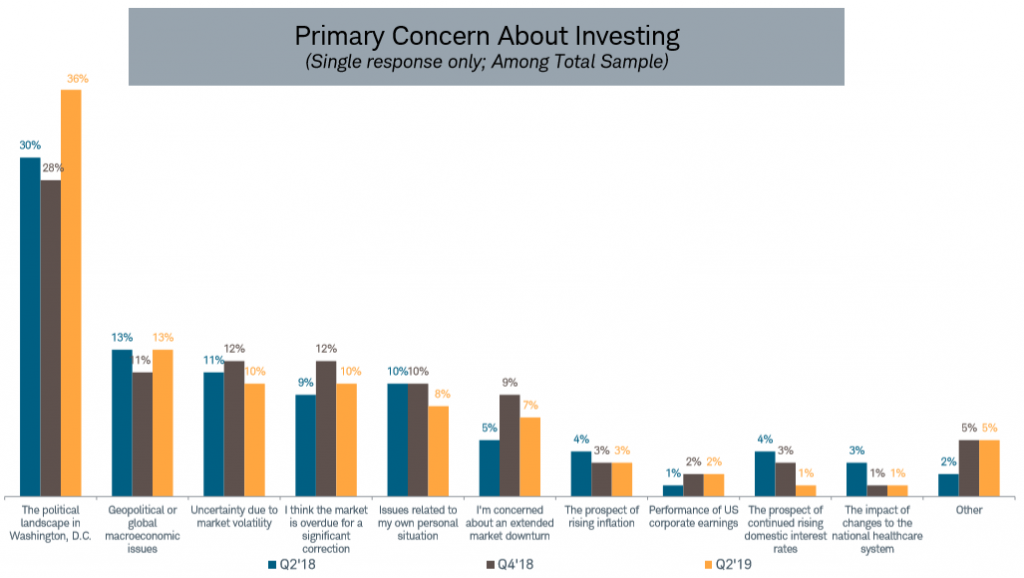
The U.S. Political Landscape is Leading Concern Among Investors – SCHWAB
THE U.S POLITICAL LANDSCAPE IS OVERWHELMINGLY THE LEADING CONCERN ABOUT INVESTING AMONG CLIENTS.
Click here for source and full document
The paranoia around presidential elections is hitting record levels, we better stop and listen to what’s going down. We spend a big portion of our life listening to storytelling. As kids, parents and teachers tell us stories. As adults the news media is about storytelling, investing is about storytelling, and nothing paints a better story than politics. I may be early with this letter as the presidential election is more than a year away but it’s possibly shaping up to be the ultimate scary story for investors.
As I write this letter, it is increasingly looking like a Trump vs. Warren election and a Trump impeachment investigation, which may be the ultimate binary event for American voters. Never in history has an election been so important except for every other election in history. Most of my conservative friends thought the world would end if Obama got elected and most of my liberal friends thought the world would end if Trump got elected.
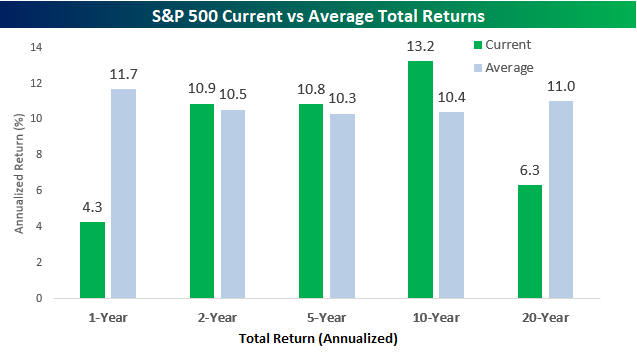
If you made either of those investing bets based on politics, your wallet is probably lighter. The chart below shows that Obama obviously did a better job with the economy. Actually this would be a false assumption, as Obama took office when the S&P was trading at generational low valuations. The single best predictor of future returns is where valuations are today, the next President will not have the luxury of beginning his or her term with low valuations.
CLICK BELOW TO READ FULL QUARTERLY LETTER
2.Another Way to View Growth Vs. Value Spreads in Valuations….Valuation Discount to Mean.
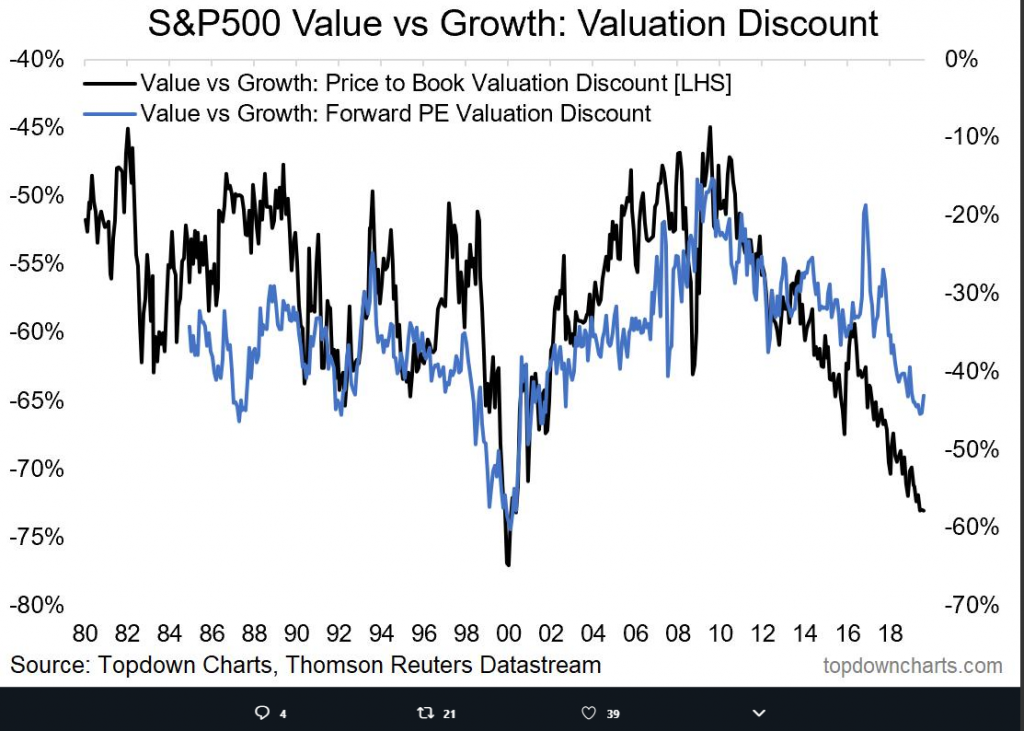
Callum Thomas Top Dow Charts
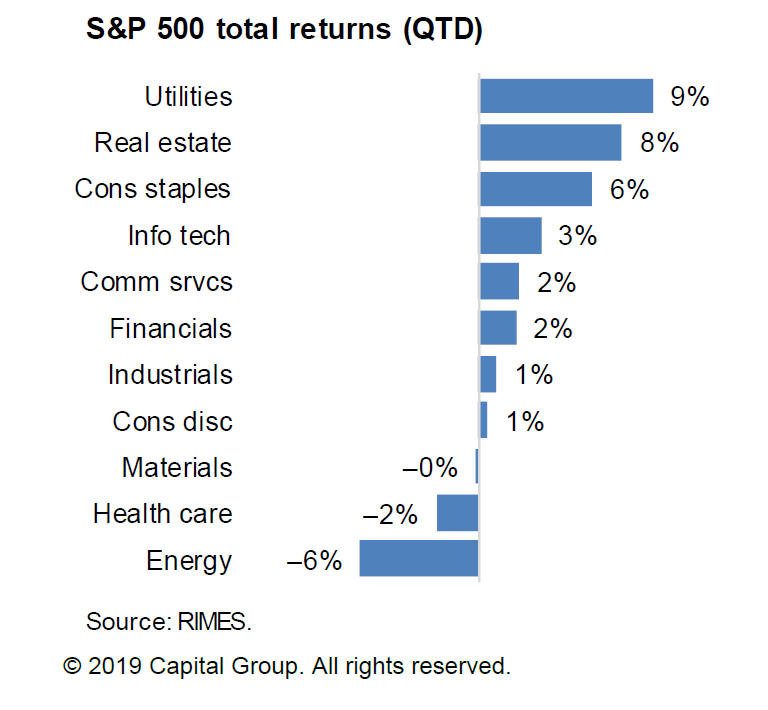
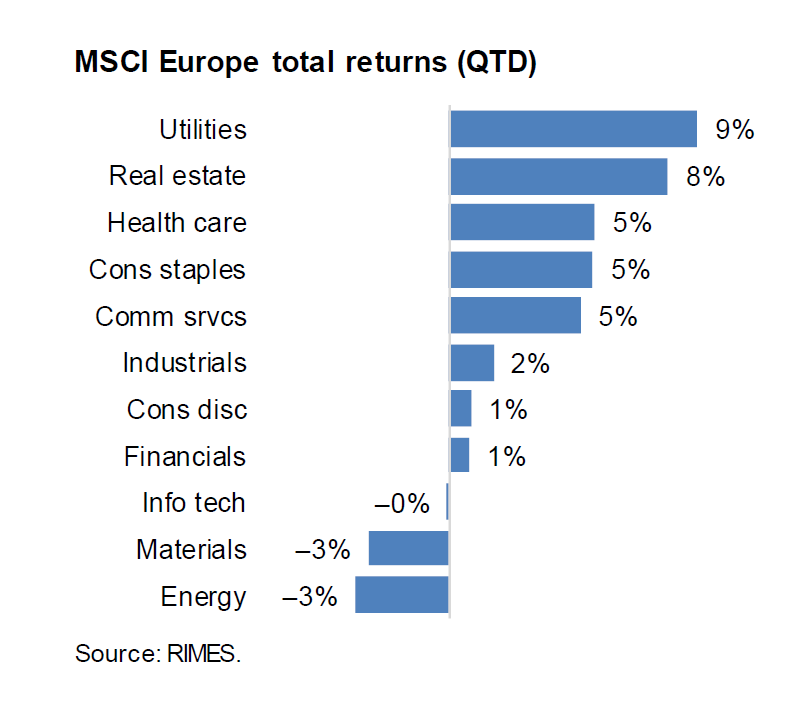
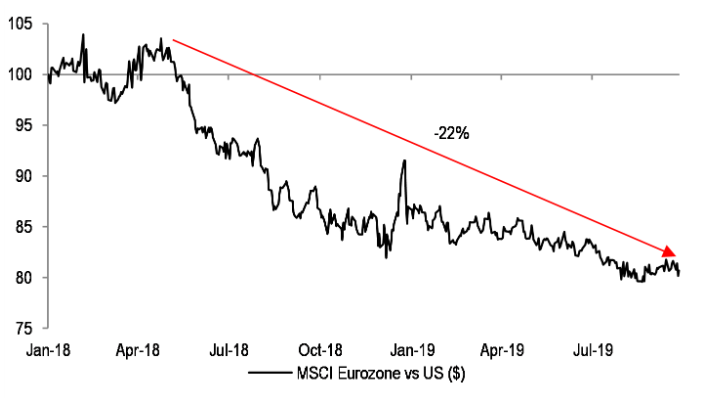
3.Comparing U.S. Sector Returns to Europe.
Capital Group Data
4.Wage Growth Slips.
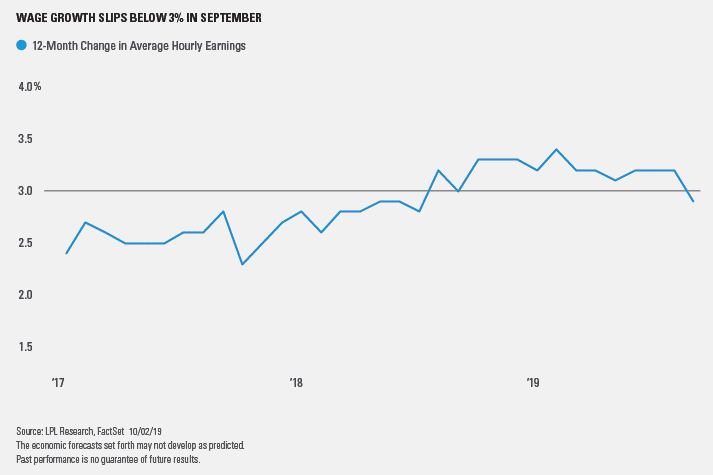
Labor Market Chugs Along
Posted by lplresearch
Economic Blog
October 04, 2019
The U.S. labor market keeps chugging along, despite signs of weakness in other pockets of the U.S. economy.
Nonfarm payrolls rose 136,000 in September, and July and August payrolls growth were revised up by 45,000. The 12-month average payrolls change climbed to 179,000 including Friday’s data, still slightly higher than the expansion average.
Overall, the September jobs report showed hiring has been steady, defying recent worries of economic weakness after surprisingly weak manufacturing and services surveys were released earlier this week. Other labor-market measures also look healthy. The unemployment rate fell to 3.5% in September, a new cycle low, and initial jobless claims are still subdued.
Wage growth slowed notably last month, though, hinting that inflationary pressures could be moderating. As shown in the LPL Chart of the Day, average hourly earnings growth fell to 2.9% year over year, the slowest pace since July 2018.
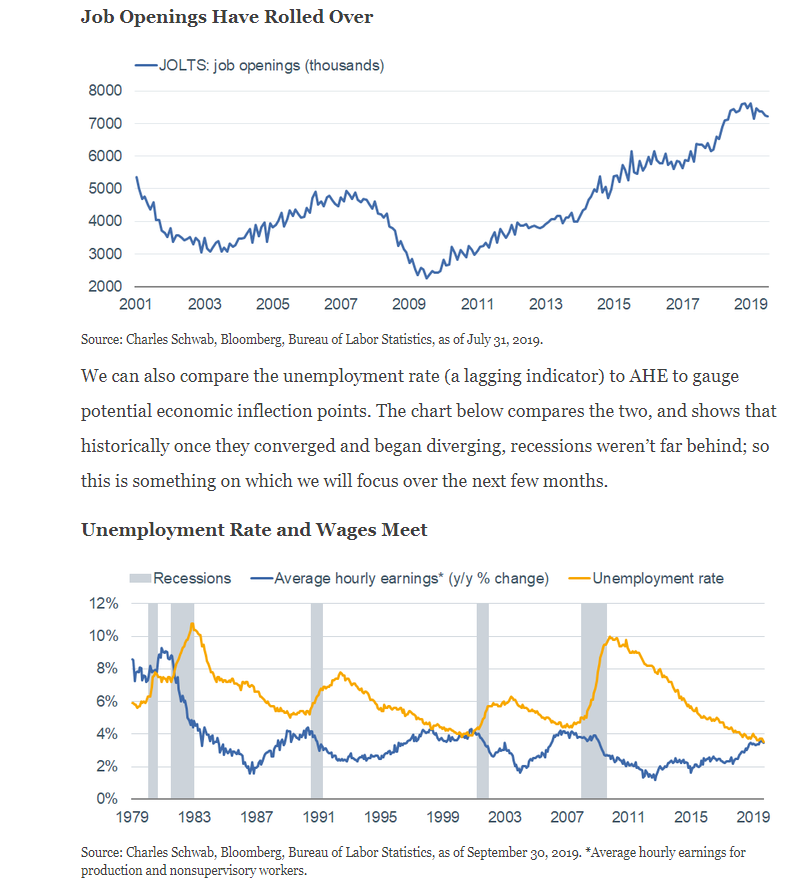
5.First Sign of Peak Jobs? Job Openings Rolling Over.
There was no movement in average hourly earnings (AHE) relative to the prior month; while the year-over-year growth rate slowed from 3.2% to 2.9%. The weakness was concentrated in managers’ pay; while production/non-supervisory wages, although softer for the month, are up 3.5% year-over-year. Wages historically follow corporate earnings, with about a one-year lag; so the significant deterioration in profits growth this year suggests further downward pressure on wages. Indeed, although still high in absolute terms, job openings have rolled over.
In sum
Employment releases are generally the most influential economic indicators for economists—and the stock market—as they guide expectations for consumer spending, consumer confidence, inflation, and income growth. But they have taken on even greater importance lately for two reasons:
- To gauge whether the weakness in manufacturing is beginning to bleed into the services/consumer segments of the economy.
- The Fed has moved from a predetermined path for interest rates to a data dependent path, with “full employment” representing half of the Fed’s dual mandate (the other being “price stability”).
Welcome to the Working Week: A Look at the State(s) of Employment

6.Hong Kong Citizens Turn to Bitcoin Amid Political Turmoil
Originally posted October 7, 2019 on Early Investing

Hong Kong is in the middle of a political crisis. Millions of citizens have been protesting since June, sparked by an extradition bill that would have allowed for criminal suspects in Hong Kong to be extradited to mainland China. Opponents argued that the bill would put Hong Kong citizens at risk of unfair and violent treatment by Chinese officials. And they worried the bill would give China greater control over Hong Kong, which China has wanted for a long time.
Investment U https://investmentu.com/hong-kong-citizens-turn-bitcoin-amid-political-turmoil/
7. Vanguard is looking to break banks’ stronghold on the $6 trillion currency market with a new blockchain platform
20 hours ago
Vanguard Group, the investment advisor with assets under management (AUM) in excess of $5 trillion and the largest provider of mutual funds in the world, is testing a new currency trading platform, reports Bloomberg citing a person familiar with the matter. Based on blockchain technology, the peer-to-peer (P2P) platform will enable asset managers to trade currencies with one another directly, bypassing the need for investment banks.
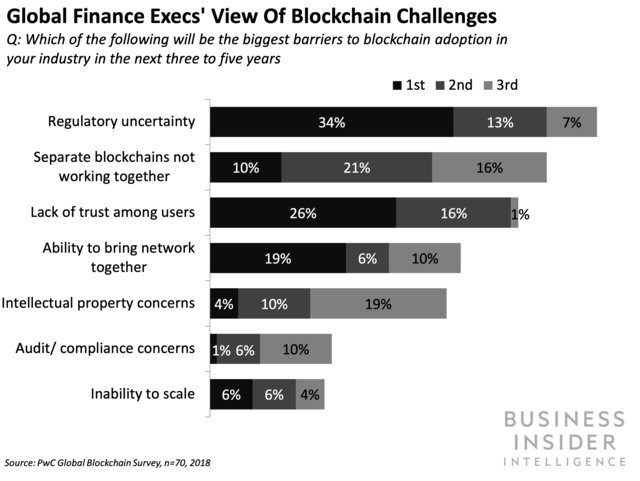
- -The FX platform would mark one of the most significant deployments of blockchain in financial services. Amid considerable hype around blockchain’s potential to upend existing processes across the financial services value chain, major players have invested billions on the technology. Yet, despite those investments, firms have struggled by and large to move their early experiments to large-scale enterprise operations. If Vanguard can successfully navigate some of the challenges that have stymied this promise — from scalability to interoperability — it would act as a litmus test for the wider industry’s stumbling blockchain ambitions.
- -And while success isn’t guaranteed, Vanguard’s pioneering legacy gives it a considerable advantage. The company has been a major driver of change within the investment space since it launched in 1975. And it’s continued this streak in recent years: For instance, while a number of banks have struggled to take advantage of the hype around robo advisors, Vanguard’s bucked that trend significantly. As of this year, the $115 billion AUM it’s amassed via its robo platform makes it the largest robo advisor, per Robo-Advisor pro. This ability to leverage emerging technology and trends within the industry to increase its share of the market makes Vanguard’s efforts to upend currency trading markets a serious threat to incumbent banks.
https://www.businessinsider.com/vanguard-group-testing-new-fx-trading-platform-2019-10
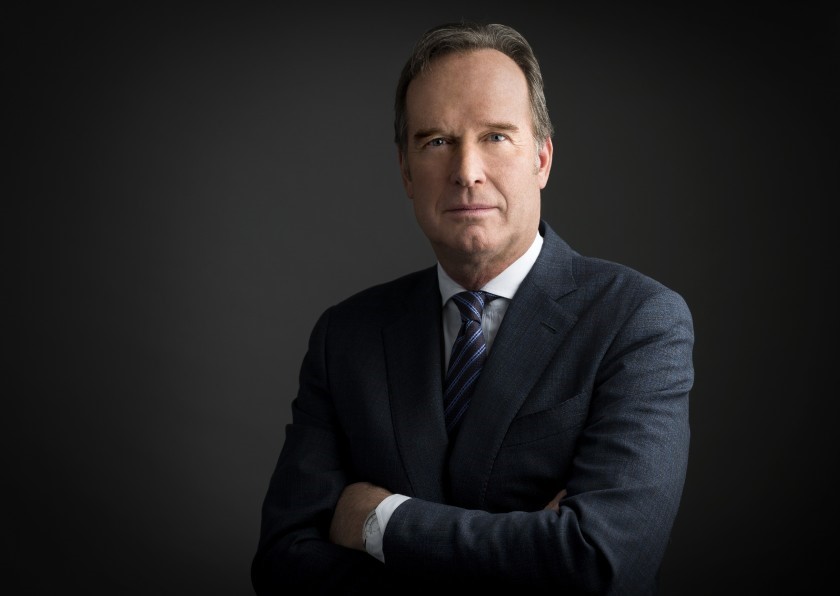
8.Blackstone CEO Stephen Schwarzman: Even billionaires have problems
The chief executive of the world’s largest private equity company on Trump, bubbles and whether he is on a farewell tour

Danilo Agutoli
By
Chris Newlands and
Selin Bucak
Even billionaires have problems that money cannot solve. Today, Stephen Schwarzman’s is traffic.
The chairman, chief executive and co-founder of Blackstone arrives 15 minutes late for our meeting at the private equity giant’s London headquarters in Mayfair.
“So many cars on the road,” says the 72-year-old, whose personal wealth is north of $18bn, according to Forbes. “It’s a real problem, sorry.”
Schwarzman, who set up Blackstone with Peter Peterson, the former chairman of now-defunct US bank Lehman Brothers, is in town to promote his new book What It Takes: Lessons in the Pursuit of Excellence.
One of the lessons cited in the book — essentially a how-to guide to being rich and successful — is punctuality. Page 55 reads: “Be on time. Punctuality is the first indicator of how much thought and preparation you have put into an interview.”
Schwarzman apologises again, adding: “Have you read the book?”
READ Blackstone commits to future in London despite Brexit fears
Lots of people have. The great and the good have lined up to provide endorsements, including Jack Welch, the former chief executive of General Electric; Ray Dalio, the co-chairman of investment company Bridgewater Associates; and Henry Kissinger, the former US secretary of state.
Even Mark Carney, the governor of the Bank of England, has taken the time to provide a quote for the front cover (“This story literally has what it takes”) — a striking move for the head of an independent British institution, which further illustrates Schwarzman’s pull.
“Mark told me he has never ever endorsed a book in his career,” says the American businessman, who hails from Philadelphia. “I have known him for some time. I sent him the book and he said: ‘This is terrific, I’m very happy to say what I think.’ You saw what he wrote. I was very happy about that.”
READ Blackstone’s billionaire co-founder says investors should worry about these five market dilemmas
Schwarzman is used to rubbing shoulders with the most influential people in politics and finance. After Donald Trump was elected president in 2016, Schwarzman became head of his short-lived advisory council, which included Larry Fink, the chief executive of BlackRock, and Jamie Dimon, the chairman of JPMorgan. The group was disbanded in 2017 in the wake of the president’s controversial remarks about a white supremacist rally in Charlottesville, Virginia.
Reports suggest Schwarzman’s relationship with Trump, who he has known for more than 40 years, has become frayed. Schwarzman had to distance himself last week from comments made by the president about the son of former vice-president Joe Biden. Trump is facing an impeachment inquiry after urging Ukraine to investigate a family member of the veteran Democrat, who is running for president.
Would Schwarzman like to see Trump get another term in the White House? “It isn’t relevant what I think,” he says, sidestepping the question. “We have now, much like you in the UK, real divided politics. It looks today, on the Democratic side, that we have Joe Biden and then Elizabeth Warren and Bernie Sanders. And on the Republican side, there is really only Donald Trump.
“Like any election outcome, it all depends on who somebody is running against. The Democrats will be running against Trump, but they as a group are going further and further left. The further they go left, the more difficult it will be for the Democrats to win.”
We return to safer ground: the nuts and bolts of the private equity market. Schwarzman and Peterson launched Blackstone in 1985 following daily breakfasts at New York’s Mayfair Hotel, where he and the former Lehman Brothers chief executive hashed out their plan to create a business that would eventually become the biggest and most influential private equity firm in the world.
In 1987 they raised their first fund at $800m. Today, Blackstone has $545bn in assets, with its biggest vehicle, Blackstone Capital Partners VIII, raising an eye-watering $26bn, making it the largest buyout fund ever.
“When we started the firm we had $400,000 — $200,000 from me, $200,000 from my partner, Pete, and last week the company was [valued at] $60bn,” he says.
It raises the question of whether there is too much money sloshing around the market and whether that cash can be put to good use. “I’ve been asked that since 1992,” he says. “The returns have stayed pretty good over the last 25-30 years regardless of peaks of markets and real collapses.
“When you are managing more money, the way historically we’ve always dealt with that is you just do bigger deals. We have never found, despite that question over the decades, that the amount of capital per se is the issue.
“The nice thing about our industry is that you don’t have to invest the money for six years. If you think things are high, you don’t have to play, you can wait. For those of us who have been doing this for most of our careers, we are used to cycles, it doesn’t bother us.”
This is not a bubble compared with 2006/07, he adds. “That was a bubble. I said it was a bubble then, and it was. Prices now are relatively high, but there is not that frenzy that happens, because the people who manage the capital have been through the global financial crisis, and once you’ve lived through that you are not anxious for a repeat.”
In the book Schwarzman writes that he does not “feel a day over 38”, the age he was when he launched Blackstone. It is true that sitting across the table, Schwarzman has a youthful energy about him for a man born in 1947 but the book, which was two years in the making, certainly has the feel of a farewell tour.
“No, not at all,” he says flatly, and we are ushered out of the room ahead of his next meeting.
CV: Stephen Schwarzman
9.Jud Bergman and Envestnet were Way Ahead of RIA Boom.
Always one move ahead, Envestnet CEO Bergman revolutionized fintech
By Suleman Din
October 04, 2019, 9:51 a.m. EDT
Envestnet CEO Jud Bergman could hold court on any of the technological disruptions affecting financial planners, having co-founded the technological services giant for the wealth management industry.
But few things could animate him more than the mere mention of chess.
“I recently had the privilege of moderating an event panel that included Jud, and I’ll never forget someone pulling me aside and saying, ‘I’ll bet you anything Jud finds a way to talk about the game of chess no matter what question you ask him,’” said Riskalyze CEO Aaron Klein.
“Sure enough, it wasn’t more than an answer or two into the panel that he started talking about how chess strategy could teach us something about where financial services was headed.”
Bergman, 62, and his wife, Mary Miller-Bergman, 57, were killed in a car collision in San Francisco on Oct. 3, the company said in a statement. The couple were in a taxi that was hit head-on by a Volkswagen Cabrio going the wrong way on northbound Highway 101, according to The Associated Press. The woman driving the other vehicle was intoxicated, the AP said.
“Today, our entire industry mourns this devastating loss. Jud’s vision and innovation forever changed the face of the financial services industry, and will continue to do so for years to come,” Klein said.
“Looking back, I’m not sure there’s anyone who has made quite as many chess moves in financial technology as Jud has, and each move has driven the industry forward and elevated the profession of financial advice.”
Envestnet’s board appointed Bill Crager, president of Envestnet and chief executive of Envestnet Wealth Solutions, as interim chief executive officer. It also appointed Ross Chapin, the lead independent director of Envestnet’s board, as interim chairman of Envestnet’s board.
“On behalf of our board of directors, management team and employees, we extend our deepest sympathies to Jud and Mary’s family. As Envestnet’s founder, Jud was a remarkable leader whose vision, brilliance and drive built the foundation for Envestnet’s success.”
Miller was the founder of Hanover Hill Wealth Advisors in Chicago.
Under Bergman, Envestnet underwent a remarkable trajectory of growth, from startup in 1999 to a tech provider able to repeatedly execute multimillion-dollar acquisitions, many leading brands themselves. The stack of technology Bergman assembled has become so formidable some predict the company will become a custodian.
Financial planning software firm MoneyGuidePro was among the latest. Envestnet purchased the Silicon Valley data aggregator Yodlee in 2015 for $660 million.
At the time, industry leaders questioned the strategy behind the acquisition, says Joe Duran, CEO of United Capital. Envestnet stock fell after the announcement, but Bergman was willing to endure short-term pain to improve his company and the advisors it supports, Duran says.
“He knew what advisors needed and was determined to shift the company to support a really complete suite of services,” he said.
Duran too recalled Bergman’s love for the game of strategy.
“We both play chess, but never got the chance to play together,” Duran says. “I suspect he would have beaten me.”
Industry leaders were stunned by the news and many sought to convey just how much Bergman did for them on a personal and professional level.
“I have watched him grow Envestnet from a startup to one of the leading firms in the industry,” said Joel Bruckenstein, founder of the Technology Tools for Today conference series.
“Despite his many achievements, he always had time for others. He was extremely kind to me. He was an industry visionary and leader. His intellect was impressive as was the breadth of his knowledge. I will miss him as an industry leader, but more importantly as a friend.”
Orion CEO Eric Clarke expressed a similar sentiment. “Jud and I had dinner on several occasions and I always had great respect for the business he built and the way that he built it,” Clarke says. “Jud had an unprecedented ability to see things that others just didn’t.
“Envestnet is in great hands with Bill [Crager], but the entire industry will miss Jud terribly,” Clarke says.
Bergman was leaving behind a legacy of leadership in technology, says Craig Iskowitz, founder and CEO of fintech consultancy Ezra Group.
“How many different ways can you say innovator or visionary? How can you explain how one person changed our industry in ways that we’re just coming to understand? How can you talk about one CEO who changed how every wealthtech firm approaches the market? There are no words.”
Many took to Twitter to share their thoughts.
“This quaint, intimate community in which we work is never more evident than times like this; when we suffer the unfortunate loss of one of our own, and this one is profound,” wrote Brian Hamburger, founder of the Hamburger Law Firm and consulting firm MarketCounsel.
Earlier this year, Bergman acknowledged in an interview with Financial Planning that his chess analogies probably needed an update, reflecting on the challenge that chess champion Gary Kasparov undertook when he played against IBM’s supercomputer Deep Blue.
With the technological changes happening on multiple fronts, the best advisors were now engaging in a game of 3-D chess, Bergman said.
“Experts plus machines deliver better outcomes than experts or machines alone,” he said. “This is a framework from which advisors, we think, ought to look at how they render advice, how they manage portfolios and manage client relationships going forward.
“What are the areas that computer software can do better and what are the areas that the human expert can do better? This is what Gary Kasparov understood and what the best advisors understand. There are some things that humans do better than computers and vice versa.”
Technology Editor , American Banker and Financial Planning
https://www.financial-planning.com/news/envestnet-ceo-jud-bergman-revolutionized-fintec
10.6 Things You Must Quit Doing Now If You Want to Be More Successful
Persistence pays off, but so does knowing when to quit. These habits are holding you back.
By Travis BradberryAuthor, Emotional Intelligence 2.0@talentsmarteq
GETTY IMAGES
Most of us grew up hearing the mantra “Don’t be a quitter,” and we’ve internalized it to the point where we feel guilty if we don’t finish a book that’s boring us to death. Our parents weren’t entirely wrong in saying that persistence is necessary for success, but sometimes quitting is the most effective course of action. Whether it’s a failed project, a thankless job, or a doomed relationship, quitting can be a virtue.
“Quitting is leading too.” –Nelson Mandela
As it turns out, some of us are really good at knowing when to quit, while others have a hard time getting “unstuck.” Research from the University of Rochester found that people are motivated by either “approach goals” or “avoidance goals.”
Those who fall into the approach camp are motivated by challenges and don’t waste time trying to solve problems that simply don’t have a feasible solution. In other words, they know when to quit.
People motivated by avoidance goals, however, worry a lot more about failing. They want to avoid failure at all costs, so they keep plugging away at things, long after logic suggests it’s time to move on. This is typically a much less productive way to work.
Knowing when to quit is a skill that can be learned. If you tend to be stuck on things long after it’s obvious that what you’re doing isn’t working, you can train yourself to do better. You just need to practice quitting. Thankfully, life provides plenty of opportunities to do this. Here are some things we should all quit doing.
1. Quit doubting yourself. Confidence plays a huge role in success. Hewlett-Packard conducted an interesting study of the process through which people applied for promotions at the company. Women, it turned out, only applied when they met 100 percent of the criteria for the job they wanted, while men applied when they met 60 percent of the criteria. The researchers postulated that one of the (many) reasons men dominated the upper echelons of the company is that they were willing to try for more positions than females were. Sometimes confidence is all it takes to reach that next level. The trick is, you have to believe you can. If you doubt yourself, it won’t work. Faking confidence just doesn’t produce the same results.
2. Quit putting things off. Change is hard. Self-improvement is hard. Scrounging up the guts to go for what you want is hard, and so is the work to make it happen. When things are hard, it’s always easier to decide to tackle them tomorrow. The problem is that tomorrow never comes. Saying you’ll do it tomorrow is just an excuse, and it means that either you don’t really want to do it or you want the results without the hard work that comes along with it.
3. Quit thinking you have no choice. There’s always a choice. Sure, sometimes it’s a choice between two things that seem equally bad, but there’s still a choice. Pretending that there isn’t one makes you a victim who is voluntarily taking on a mantle of helplessness. To play the victim, you have to give up your power, and you can’t put a price on that. To succeed at the highest level, you have to quit giving your power away.
4. Quit doing the same thing over and over again and expecting a different result. Albert Einstein said that insanity is doing the same thing and expecting a different result. Despite his popularity and cutting insight, there are a lot of people who seem determined that two plus two will eventually equal five. The fact is simple: If you keep the same approach, you’ll keep getting the same results, no matter how much you hope for the opposite. If you want different results, you need to change your approach, even when it’s painful to do so.
5. Quit thinking everything is going to work out on its own. It’s tempting to think that it’s all going to work out in the end, but the truth is that you have to make it work. This has many implications. Don’t expect your boss to notice when you’re ready for a promotion, don’t expect your colleague to stop sloughing work off on you if you’re always willing to do it, and don’t think that anyone is going to stop walking all over you as long as you allow it. Everything is not going to magically work out on its own; you have to be proactive and take responsibility for yourself.
6. Quit saying yes. Every yes you utter is a tradeoff. By saying yes to one thing, you’re saying no to something else. Saying yes to staying late at work, for example, might mean saying no to the gym or to time spent with your family. Research conducted at the University of California, San Francisco, showed that the more difficulty you have saying no, the more likely you are to experience stress, burnout, and even depression. Saying no is indeed a major challenge for many people. No is a powerful word that you should not be afraid to wield. When it’s time to say no, avoid phrases such as I don’t think I can or I’m not certain. Saying no to a new commitment honors your existing commitments and gives you the opportunity to successfully fulfill them. When you learn to say no, you free yourself from unnecessary constraints and free up your time and energy for the important things in life.
Bringing It All Together
There are dozens of ways we get in the way of achieving our full potential. We doubt ourselves, we decide that something is just too hard, or we tell ourselves that we’ll worry about it tomorrow. If you really want to succeed–and I mean really succeed–stop focusing so much on what you should be doing and, instead, take a really good look at the things you should quit doing.
What other things should people quit doing? Please share your thoughts in the comments section, as I learn just as much from you as you do from me.