1. Margin as a Percentage of Total Stock Market
Trending down and well below 2008 levels
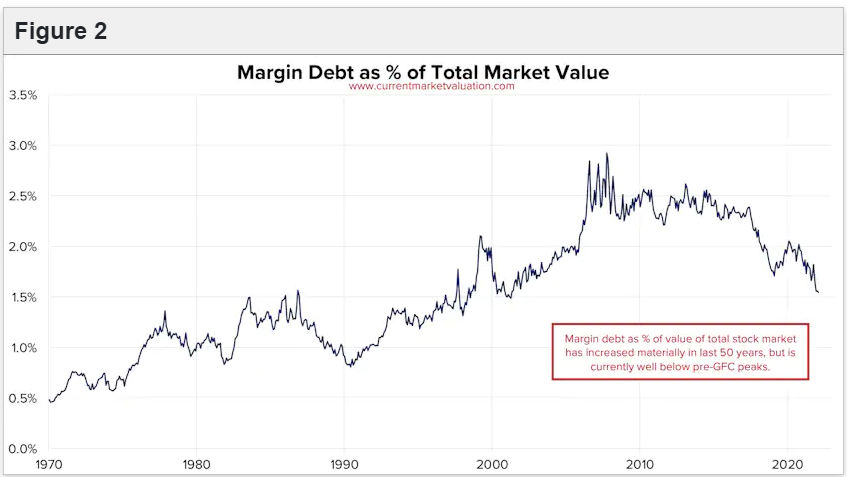
https://www.currentmarketvaluation.com/models/margin-debt.php#:~:text=Since%20margin%20tends%20to%20increase,the%20entire%20US%20stock%20market.
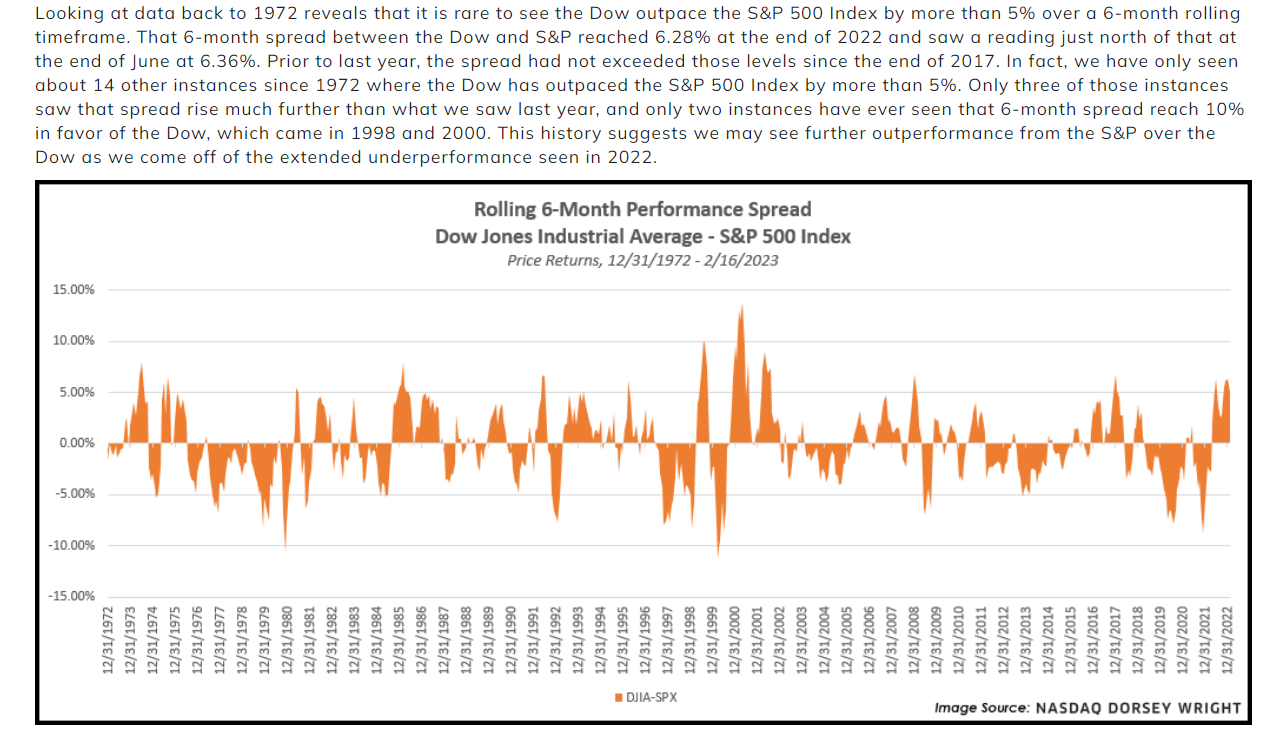
2. Dow vs. S&P Returns History
Nasdaq Dorsey Wright
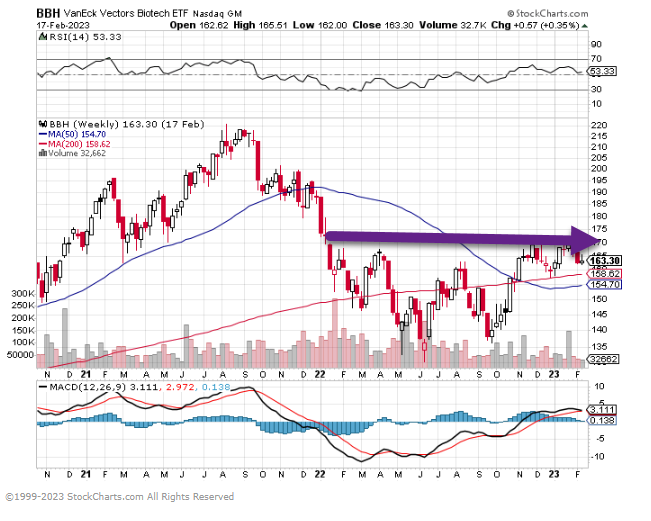
3. Biotech Stocks
BBH Biotech ETF rally off bottom but not back to Jan 22 levels yet…….well below all-time highs
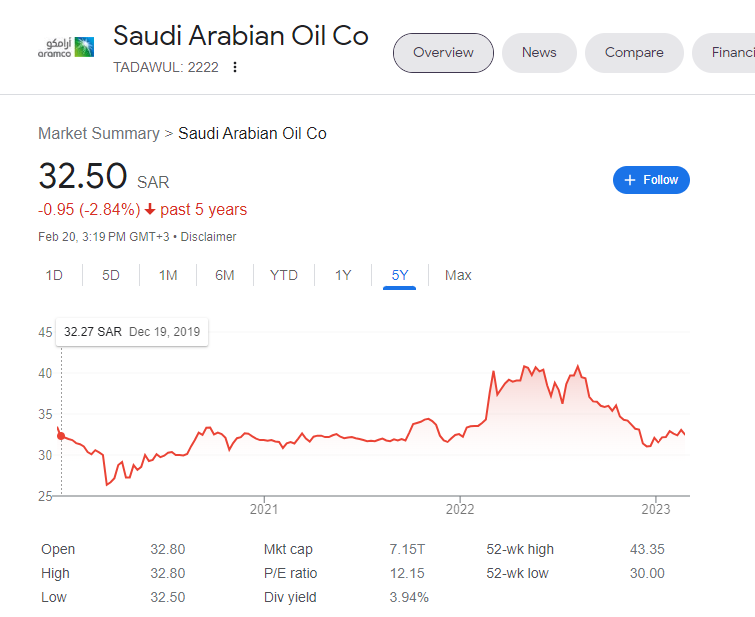
4. Aramaco Biggest IPO Ever…Bull Market in Energy……..5 Year Return Still Negative
https://www.google.com/search?q=aramco+stock+chart&rlz=1C1CHBF_enUS898US898&oq=aramco+stock+chart&aqs=chrome..69i57j0i390l5.4094j1j7&sourceid=chrome&ie=UTF-8
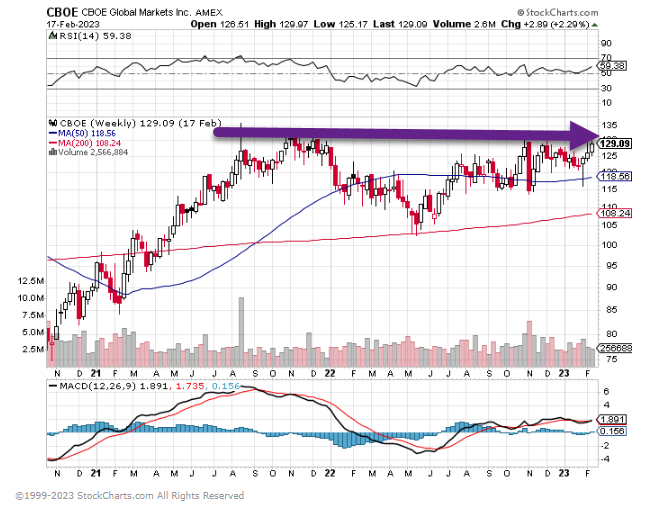
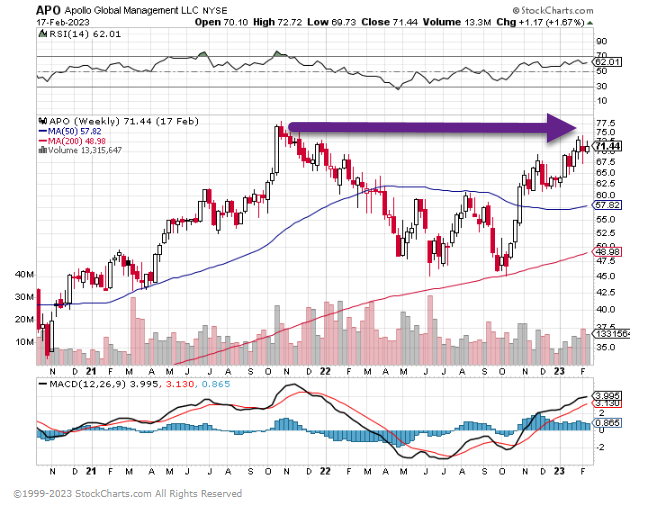
5. Private Equity Leader Apollo Management Traded Right Back to 2021 Highs
APO never broke 200-week moving average red line
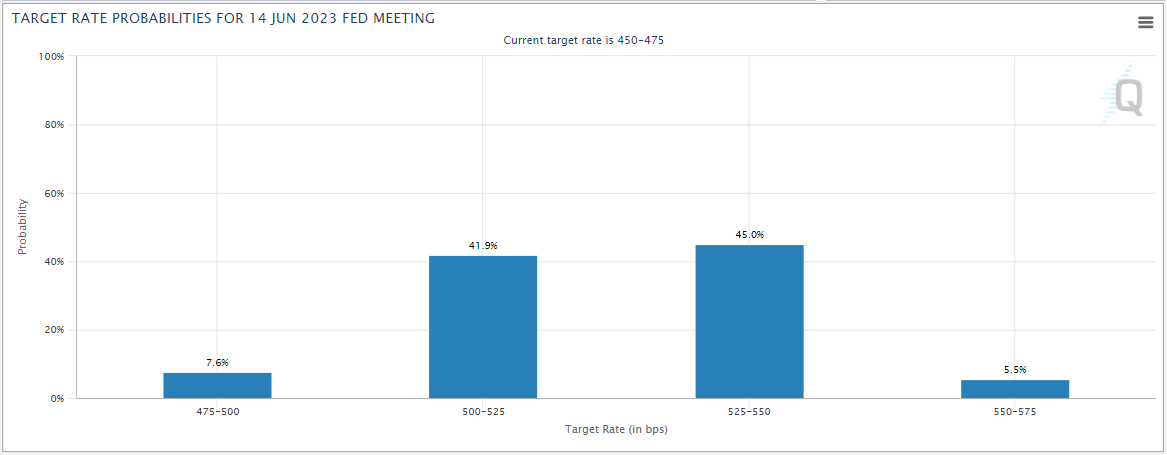
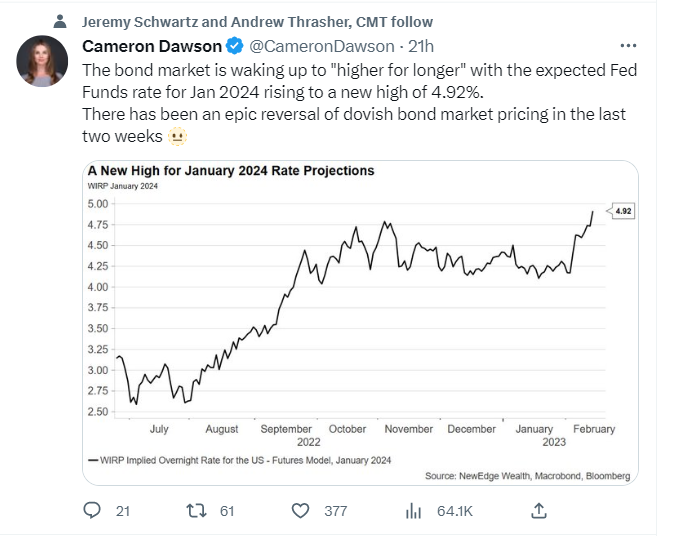
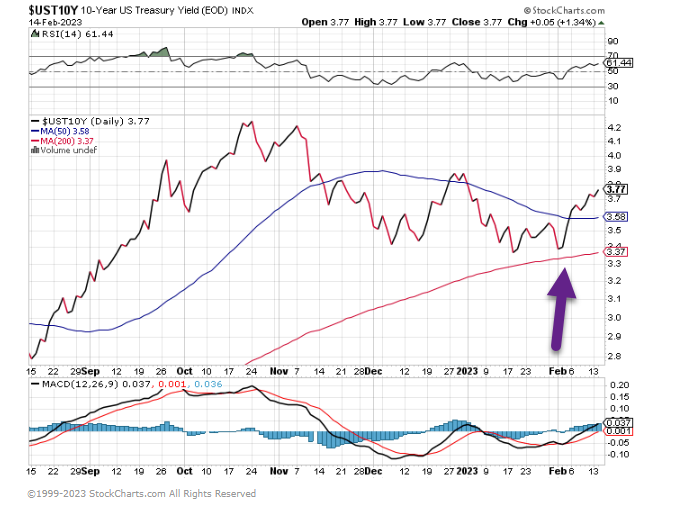
6. The Market Implied Terminal Rate Up 40 Basis Points this Month.
WHAT IS THE TERMINAL RATE? INVESTOPEDIA KEY TAKEAWAYS
- The terminal federal funds rate is the final interest rate that the Federal Reserve sets as its long-term target for the federal funds rate.
- The federal funds (fed funds) rate is often used as a benchmark for other interest rates in the economy, such as mortgages, auto loans, and corporate bonds, among several others.
- The Federal Open Market Committee (FOMC) is responsible for determining both the current and the terminal federal funds rates.
- Determining the terminal rate is not an exact science and involves forecasting future economic conditions such as inflation, gross domestic product (GDP) growth, and unemployment.
The market-implied terminal rate is up some 40 bps this month.
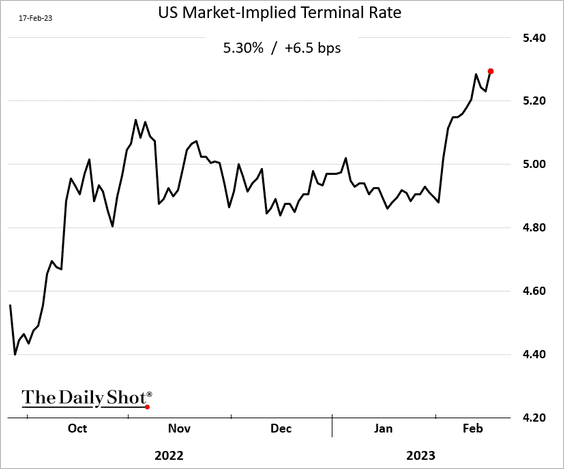
Source: The Daily Shot https://dailyshotbrief.com/
7. Elon Musk’s latest US price drop brings Tesla’s electric-vehicle premium to a record low.
Bloomberg Tom Randall The chart below shows the difference in price between Tesla’s best-selling models and the average price paid for a new vehicle in the US each month.
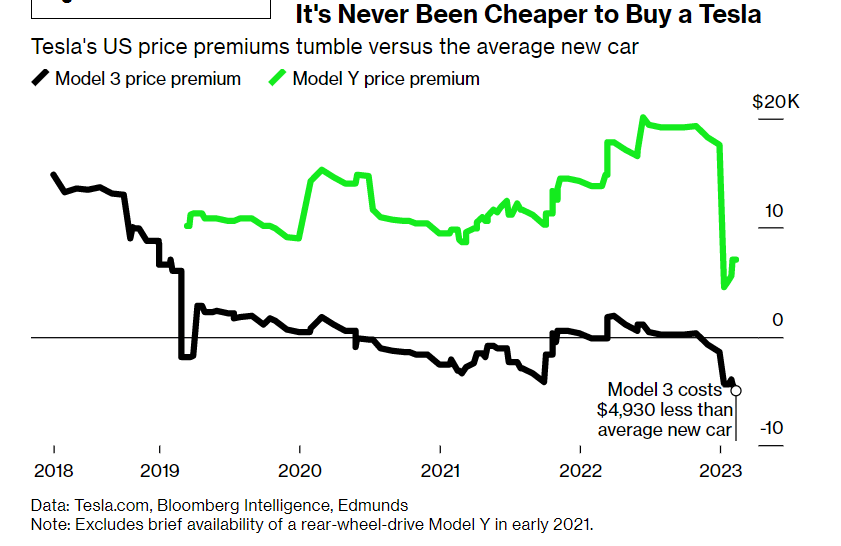
https://www.bloomberg.com/news/articles/2023-02-21/tesla-undercuts-average-us-car-by-almost-5-000-in-ev-shakeout?srnd=premium&sref=GGda9y2L
8. Delinquencies in Subprime Auto Loans Spike
WSJ By Ben Eisenand Gina Heeb Some 9.3% of auto loans extended to people with low credit scores were 30 or more days behind on payments at the end of last year, the highest share since 2010, according to an analysis by Moody’s Analytics.
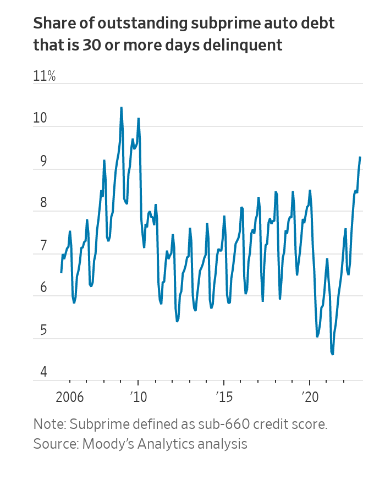
More Auto Payments Are Late, Exposing Cracks in Consumer Credit – WSJ
9. Growth in U.S. Labor Force.

https://www.linkedin.com/in/ericfinningan1/
10. 60 Top Tips to Live Longer, Doctor-Approved
Novos Longevity
How much are you doing to slow down your aging and maximize your lifespan and health span? Lots of things contribute to the aging process, many of which will surprise you!
We’ve put together this list of more 60 tips to slow your aging and live longer, all backed by research.
Skim through it to see what you’re already doing, and what will be easy for you to integrate into your daily routine.
DIET
1. Reduce your intake of animal protein, especially processed red meat such as sausages, salami, bacon, ham, hot dogs, pâtés, etc.
2. Replace red meat (e.g., beef, pork, mutton, veal) with white meat (poultry), fatty fish (e.g., salmon, herring, mackerel), and meat substitutes (based on tofu, pea, or mushroom protein).
3. Consume lots of vegetables, legumes, mushrooms, fruits, nuts, and seeds. Vegetables should be the basis of your diet (not potatoes, pasta, rice and bread).
4. Reduce your intake of starchy, empty-calorie foods like bread, pasta, rice, and potatoes. Replace them with more vegetables, legumes, mushrooms or quinoa.
5. Avoid sugary foods and drinks as much as possible, like sodas, fruit juices, candy, cookies, sweets, cake, pastries, doughnuts, candy bars, chocolates and so on.
6. Avoid trans fats, which can be found in fried foods, fast-food, bakery products (e.g., crackers, cookies, and cakes), and vegetable shortenings.
7. Significantly reduce your intake of omega-6-fat-rich foods, like corn oil, sunflower oil, safflower oil, margarine, sesame oil, mayonnaise, and most salad dressings.
8. Consume more healthy fats, especially omega-3 fats, by consuming more olives, olive oil, walnuts, avocados, flax seed, chia seed, fatty fish, and so on.
9. Consume foods that have come straight from nature and are processed as little as possible, like foods your great-grandmother would recognize.
10. Consume a daily, freshly made smoothie with vegetables and low-glycemic-index fruits, like blueberries.
11. Eat specific foods that can slow down aging, including green leafy vegetables (broccoli, spinach, kale), blueberries, dark chocolate (containing at least 70% cacao), salmon, walnuts, pomegranate, etc.
12. Don’t drink milk – milk accelerates aging.
13. Don’t drink too much alcohol: that means a maximum of one glass per day, ideally with alcohol-free days.
14. Hardly drink any sugary drinks (such as soda, commercial fruit juices, etc).
15. Hydrate a lot. Drink at least 1.5 liters per day; that’s eigth glasses per day.
16. Drink lots of water. Drink green tea, white tea, ginger tea or coffee (yes, coffee can reduce the risk of various aging-related diseases). Add spices (e.g., mint), citron or NOVOS Core to add taste to your water.
17. Don’t take whey protein, testosterone or growth hormone. They all accelerate aging in the long term.
18. Don’t follow unhealthy diets – most diets are unhealthy, unfortunately.
19. Don’t follow a paleo diet or a high-protein diet: these diets accelerate aging in the long term, despite having beneficial effects in the short term (like weight loss).
20. Don’t follow a keto diet (ketogenic diet) or a high-fat diet: these diets accelerate aging in the long term, despite having beneficial effects in the short term (like weight loss).
21. Follow the NOVOS Longevity Diet.
22. Eat fewer calories, and less often. Try to eat two meals a day, with breakfast being the most important meal of the day.
23. Fast regularly. Eat within a 12-hour period, so your body can fast for 12 hours. Fast for ideally three days a few times per year, like at the start of every new season.
SUPPLEMENTS
24. Take health supplements, like vitamin D3, vitamin K2, iodine, selenium, magnesium, B vitamins, and minimally oxidized (low TOTOX) omega-3 fatty acids. You can find the most important health supplements here.
25. Take longevity supplements like NOVOS Core that contain substances that scientifically have been shown to slow down aging or increase lifespan, like alpha-ketoglutarate, fise
26. Don’t take antioxidants beyond what you find in a healthy diet. Most antioxidants don’t extend lifespan and some can even shorten lifespan and increase the risk of cancer (learn more here).
27. Consider taking drugs that could slow down aging, like metformin, low-dose rapamycin, low-dose (baby) aspirin, or selegiline. Always discuss with a physician experienced in this matter.
EXERCISE
28. Engage in anaerobic exercise (like weightlifting).
29. Do aerobic exercise (like running or swimming).
30. Do high-intensity interval training (HIIT).
31. Commit to stretching and posture exercises, like pilates.