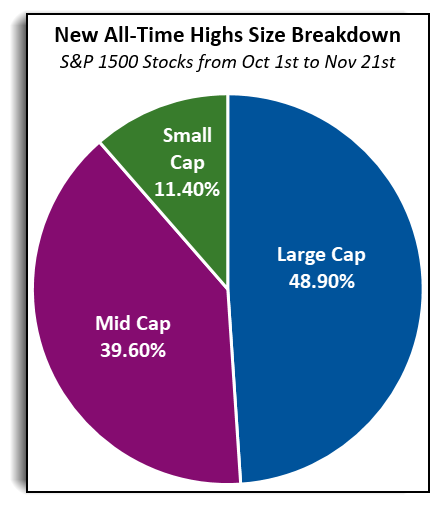
1.New
All-Time Highs in Equities Still Led by Large Cap.
When we examine these
areas of the broader market by way of the aggregated S&P 1500 Index, we
find that a total of 237 stocks (about 16%) within the index have moved to new
all-time highs since October 1st. As shown in the chart below, we can see that
some areas of the market are participating more in this rally than others.
Large caps have led the way, not only by performance but also by
headcount, accounting for 116 of the 237 stocks (48.9%) moving to new
highs. Mid-caps are next in line with 94 stocks (39.6%), followed by small
caps with 27 stocks (11.4%).
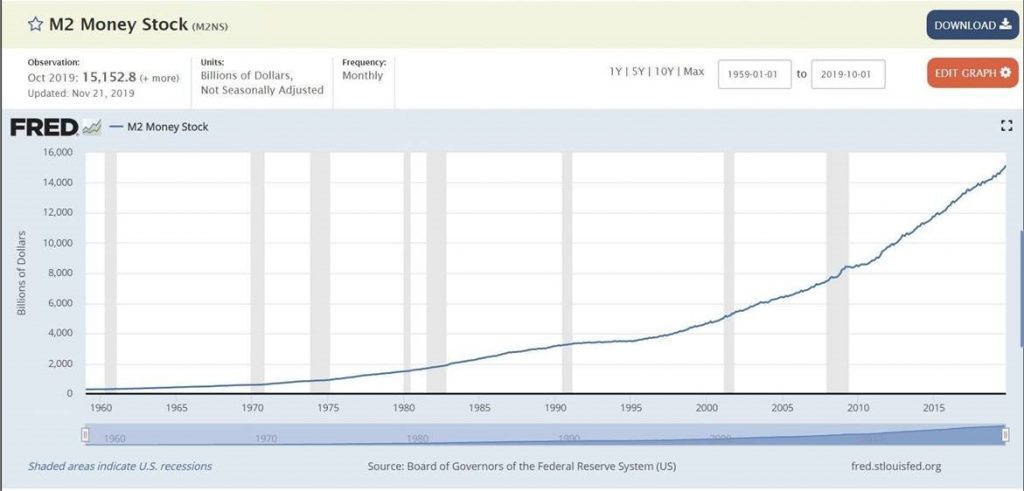
1.M2 Money
Supply Growing at 10.4% Clip Over Last 3 Months.
“Jason
DeSana Trennert, who runs Strategas Securities, notes that the M2 money
measure—cash, checking, savings deposits, small certificates of deposit, and
money-market funds—has been growing at a rapid 10.4% annual clip over the
past three months.
Supporting that growth
has been the rapid expansion of the Federal Reserve’s balance
sheet, which has climbed at a 31% yearly rate over that span. While the Fed
says its monthly buying of $60 billion of Treasury bills doesn’t represent
quantitative easing—the central bank’s past rounds of securities purchases to
stimulate the economy—Trennert calls it a “distinction without difference for
owners of risk assets,” such as stocks. The expansion has been international,
adds Evercore ISI, which points out that the balance sheets of the European
Central Bank and the Bank of Japan also are headed
higher.”
Going back to 1928, there have been 17 occasions when the S&P
500 has scored an annual gain bigger or equal to 25%.
And 71% of the time, the S&P 500 is positive in
the following year with an average gain of 7%, a CNBC analysis using
FactSet data found.
The S&P 500 has only had five negative years following a 25%
annual return since 1928.
The
record-breaking rally has brought the S&P
500′s return this year to nearly 25%, and if the gains hold up for
the rest of the year, the market could have more room to run in 2020 if history
is any guide.
Going back
to 1928, there have been 17 occasions when the S&P 500 has scored an annual
gain bigger or equal to 25%. And 71% of the time, the S&P 500 is positive
in the following year with an average gain of 7%, a CNBC analysis using FactSet
data found.
The S&P
500 was up 24.5% for the year through Friday’s close. Futures were pointing to
some more gains on Monday.
The average
is skewed by a 36% loss in 1936 around the Great Depression. Looking at the
average performance in the “modern” era from 1950 forward, the average annual
performance is a gain of 11.25% for the S&P 500 after a banner year.
The S&P
500 has only had five negative years following a 25% annual return since 1928.
Wall Street
strategists and investors have said it’s all coming down to President Donald Trump and
the China trade war if the market can close out the year with solid gains. The
market has been moving on any development in the U.S.-China trade war for
nearly two years.
Optimism on
a trade resolution has risen recently after the two countries reached a truce
and started working up a so-called phase one deal. White House economic advisor
Larry Kudlow said the two countries were “getting close” to reaching a trade deal,
sending stocks to new all-time highs.
To be sure,
next year could be unpredictable due to the upcoming presidential
election. Wall Street is already worried about the
ascent of Massachusetts senator Elizabeth Warren and her wealth tax proposals.
Notable investors including billionaire Paul Tudor Jones and longtime
investor Leon Cooperman have warned of a market correction, should Warren take
the White House.