1.Bonds are Safe? 30 Year has Lost 15% Since August and 12% Since October.
VGLT-Long Term Government Bond ETF.
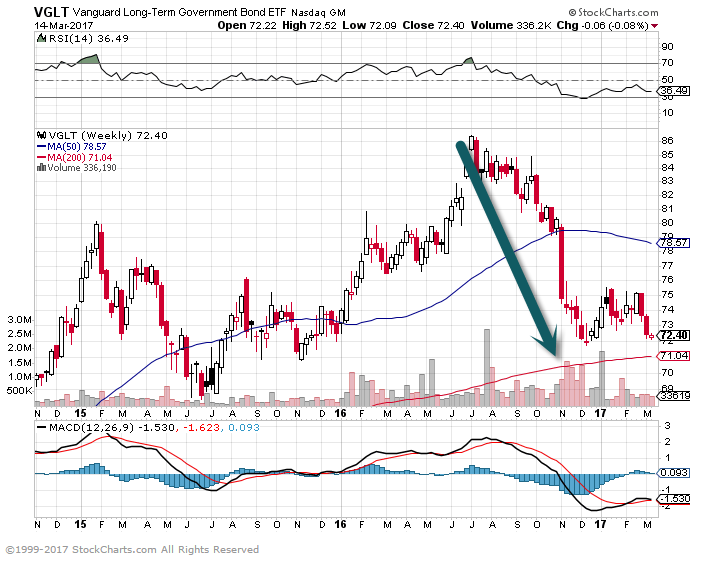
VGLT-Long Term Government Bond ETF.
Top 10 will be a little sporadic in near-term due to travel into next week…Thanks


State Street SPDRs Group Does Great Work… Click for More
http://statestreetspdrs.com/1381/files/March_Chart_Pack_2017.pdf
Greetings,
The United States: The futures-implied Fed Funds rate hike probability for this month rose to 94%.
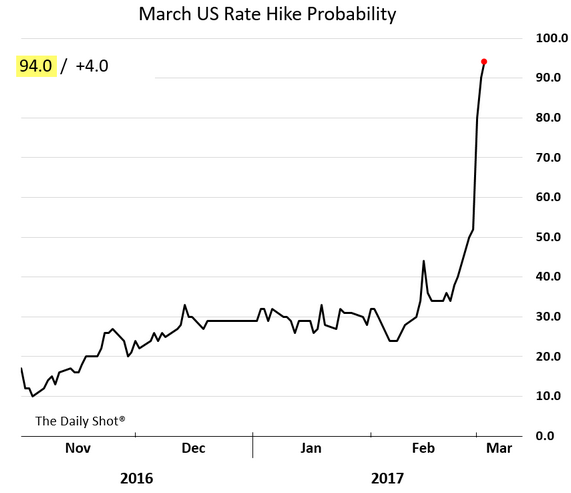
Source: @GregDaco, @WSJ, @JoshZumbrun; Read full article
www.thedailyshot.com
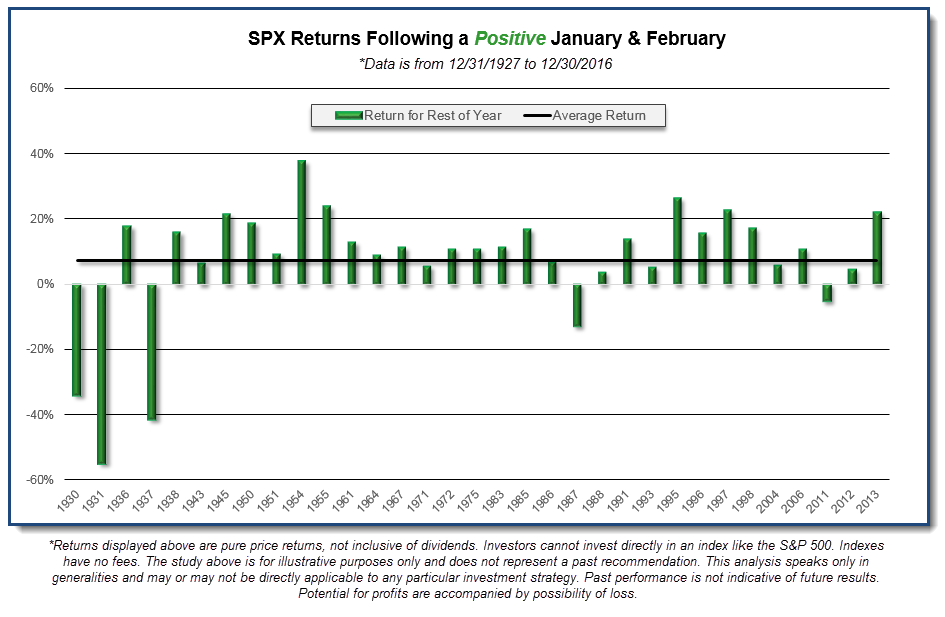
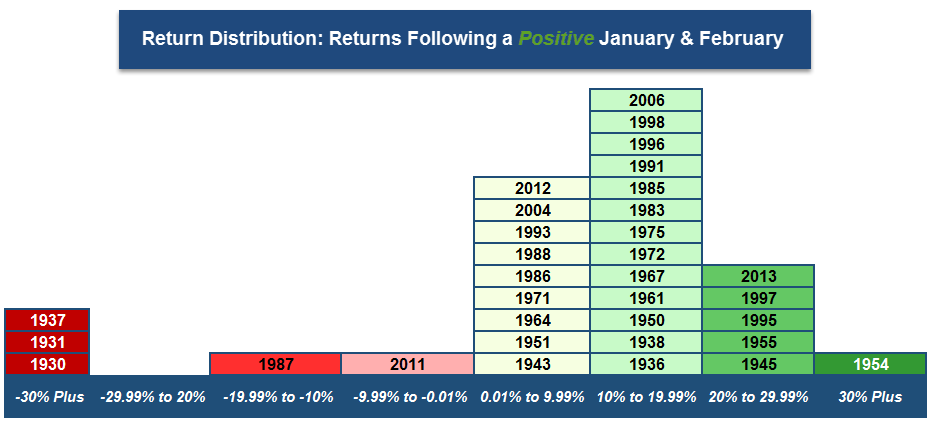
The images below show a bell curve and bar chart of the SPX returns for the remainder of the year (March – December) when both January and February returns were positive. As we can see from both images, the market tends to finish in positive territory for the remainder of the year as well, though there are a few exceptions. Here are some statistics from our findings:
· During the years where January and February were both positive the combined months average return was 7.40% (out of 33 occurrences). In 2017, the SPX was up 5.57% from 12/30/2016 to 2/28/2017.
· The remainder of the year (March – December) the SPX was up an average of 7.37%.
· Out of the 33 occurrences, 28 occurrences were positive (84.85%) and 5 were negative (15.15%).
· Average return for just the 28 positive occurrences was 14.01%.
· Of the five negative occurrences, three of them date back to the 1930’s. The two other negative occurrences were 1987, which saw the SPX fall -13.06% from March thru December (largely due to the October crash), and 2011, when the SPX finished down -5.24% from March to December.
 From Dorsey Wright
https://oxlive.dorseywright.com/research/bigwire/