1.China stocks rally to a 9-month high after Beijing promises trade secret protection for foreign companies
- -The Shanghai Composite Index is near a nine-month high on hopes of an end to the US-China trade war.
- -China promised spending, tax cuts, and protection of foreign companies’ technology secrets.
- -“A high degree of optimism [is] already baked into markets,” FXTM said.
China ETF held 200 day on weekly chart.
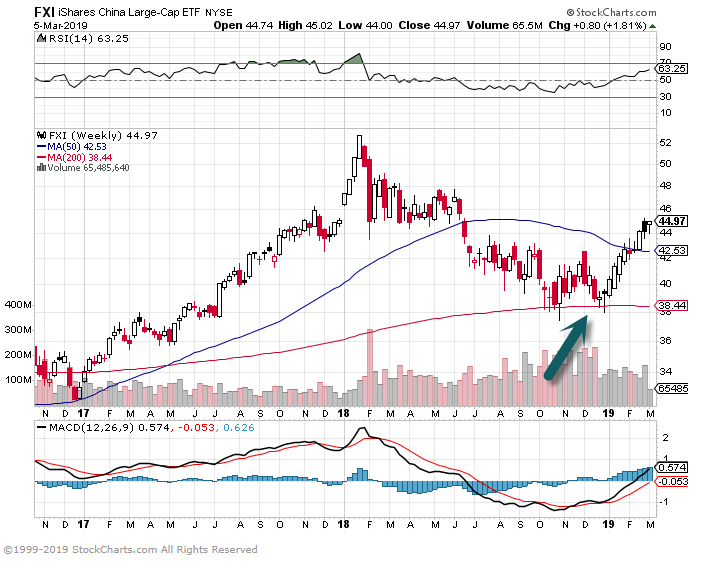
China ETF daily chart 50day about to go thru 200 day to upside.

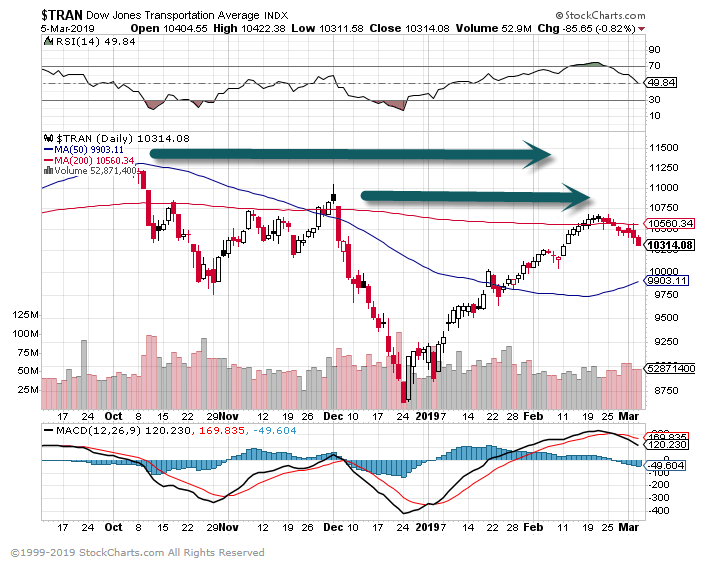
2.Dow Tranports Chart
Transports fail and rollover at Dec. highs still below 2018 October highs
3.Since 1854, the average length for recessions in the United States has been 18 months, with a new recession starting every 58 months.
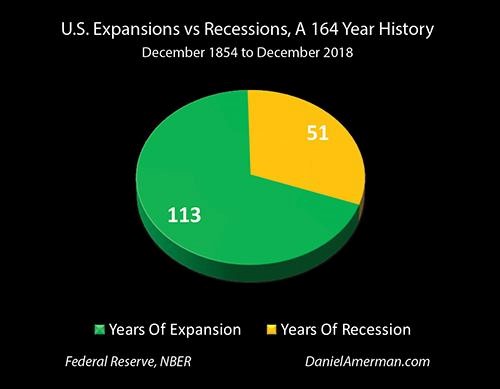
A New Great Recession, Once Every 5 Years Daniel Amerman, CFA https://seekingalpha.com/article/4239681-new-great-recession-every-5-years
4.Unicorn IPO Wave 2019
A giant IPO wave is coming as ‘unicorns’ whet investor appetite
- Renaissance Capital has a watch list of 226 private companies that are planning to go public in 2019. These companies represent a value of $697 billion.
- IPOs could raise $100 billion this year, smashing through the records set in 1999 and 2000.
- High-profile deals are on deck for Lyft, WeWork, Uber and Airbnb.
Source: Nasdaq
SurveyMonkey IPO at the Nasdaq market site
Big IPOs waiting in the wings
(estimated valuations)
Uber $76 billion
GE Health Care $65 billion
WeWork $47 billion
Palantir $41 billion
Airbnb $31 billion
Lyft $15 billion
Source: Renaissance Capital
https://www.cnbc.com/2019/02/04/a-giant-ipo-wave-is-coming-as-unicorns-whet-investor-appetite.html
2018 Saw No Upswing in Tech IPOs
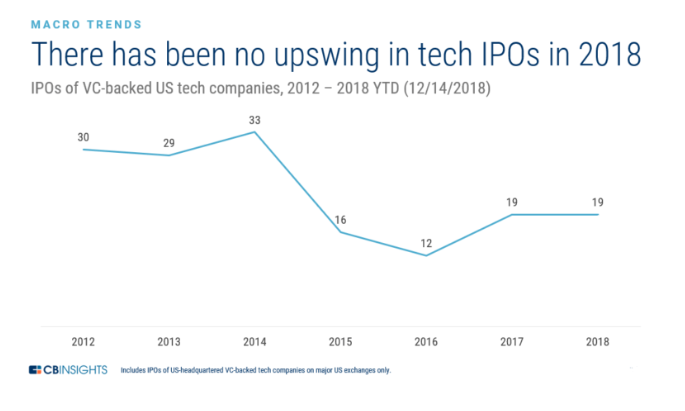
https://www.cbinsights.com/research/report/tech-ipo-report-2019/
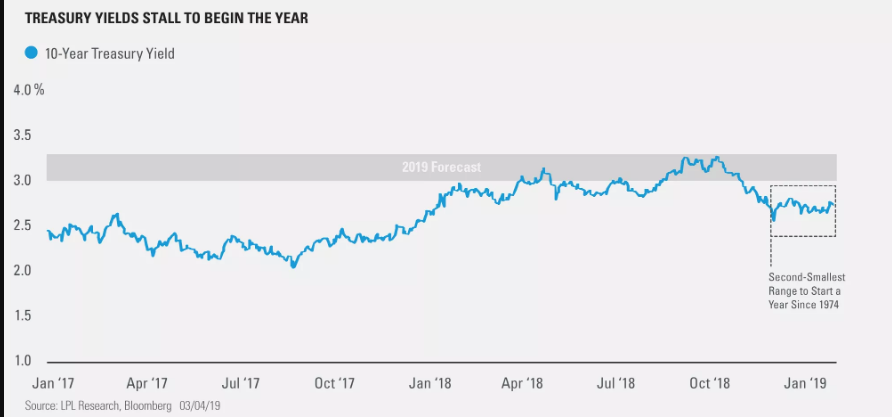
5.Interest Rates…Treasuries Start Year with Second Smallest Range Since 1974
A Historic Quiet for Rates
Posted by lplresearch
Treasury yields have been historically quiet this year.
As shown in the LPL Chart of the Day, the 10-year Treasury yield has bounced around in a 23-basis point (bps) (.23%) range year to date, the second-smallest range at this point in the year since 1974.
It may be difficult to imagine a breakout in either direction, but we expect the 10-year yield to end 2019 between 3% and 3.25%, or about 30 to 50 bps (.30–.50%) higher than where the benchmark yield is trading now.
https://lplresearch.com/2019/03/05/a-historic-quiet-for-rates/#more-12257
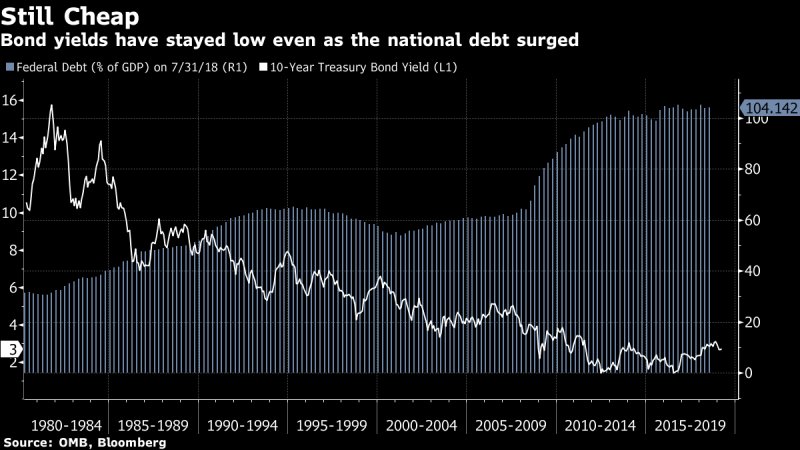
6.Government Debt Surge Has Not Been Met by Higher Rates.
View photos
Larry Summers Slams MMT as ‘Fallacious’
More
(Bloomberg) — Talk to Wall Streeters about Modern Monetary Theory and they tell you Jerome Powell was right: The manifesto for free-spending governments is a terrible idea -– and if it’s ever implemented, America can expect a nightmarish financial future.
But right now, the $15.6 trillion U.S. Treasury market seems to be as relaxed about budget red ink in practice as the MMTers are in principle.
Benchmark 10-year yields remain below 3 percent, a historically low level, even as America plunges deeper into deficit and jacks up debt sales to a record. That’s no surprise to MMT economists — who predict more of the same. They argue that because the U.S. borrows in its own currency, it can print dollars to cover its obligations, and can’t go broke. And when inflation is low, as it is now, there’s room to spend more.
Last week, Federal Reserve Chair Powell described that school of thought as “wrong.’’ Investors tend to agree that it would end in tears one day. Just not anytime soon.
“You have to say that markets are willing to be patient for a while with this kind of stuff,’’ said Michael Shaoul, chief executive officer at Marketfield Asset Management LLC.
Everyone Did It
https://finance.yahoo.com/news/powell-trashed-mmt-wall-street-110000969.html
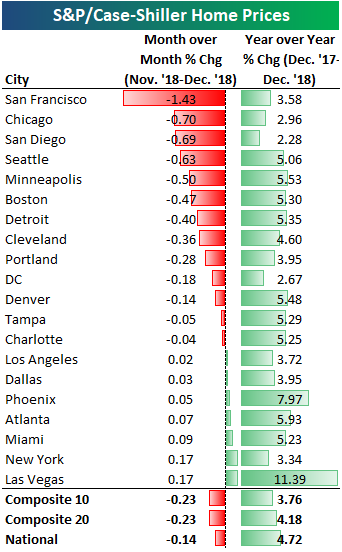
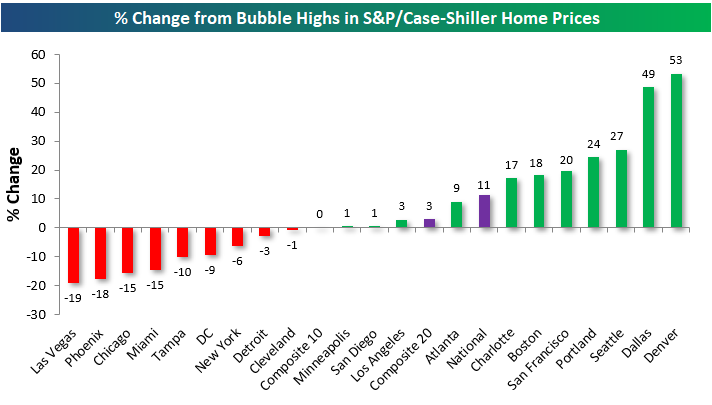
7. 2018 Home Price Trends for Major US Cities/Regions
The most recent Case Shiller home price data for the 20 cities tracked was released last week, and below we have updated a number of charts and tables that we’ve published on a regular basis over the years. The first table shows the month-over-month and year-over-year change in home price values across the country. After years of seeing all green in this table, we’ve seen a string of month-over-month declines recently. The composite 10-city and 20-city indices both fell 23 basis points in December, while the “National” index saw home prices dip 14 basis points.
San Francisco saw the biggest month-over-month decline at -1.43%, followed by Chicago (-0.70%), San Diego (-0.69%), and Seattle (-0.63%). Seven of twenty cities saw small month-over-month gains, led by New York and Las Vegas at +0.17%.
On a year-over-year basis, every city still posted home price gains, but those gains are getting smaller and smaller as the months progress.
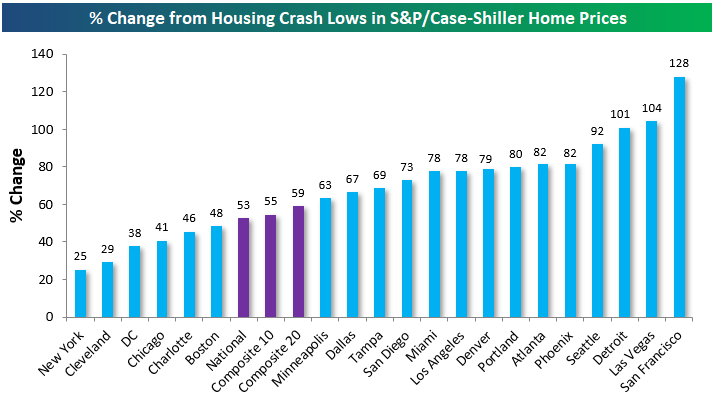
The chart below shows how much each city has seen home prices gain off of their housing crash lows that were put in sometime between 2010 and 2012 for most cities. San Francisco is up 128% off of its lows, while Las Vegas and Detroit are both up more than 100% as well. The National index is up 53% off of its low, while New York home prices have bounced the least at just 25%.
The next chart shows where home prices stand for each city relative to their peak during the housing bubble of the mid-2000s. The National index is up 11% from its prior all-time high that was made in July 2006. Denver prices have soared the most above their prior highs at +53%, followed by Dallas at +43%. On the flip side, Las Vegas is still the furthest below its housing bubble highs from the mid-2000s at -19%. Phoenix, Chicago, Miami, and Tampa are all still 10%+ below their prior highs as well.
https://www.bespokepremium.com/think-big-blog/
8.Before 2009…We Never Saw a 30 Year Mortgage Rate Below 5%
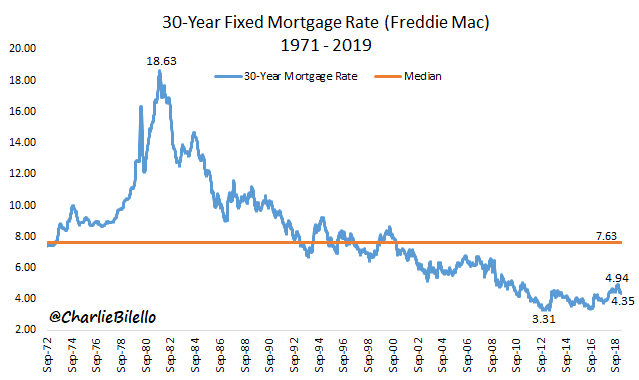
https://twitter.com/charliebilello/status/1102413725108260864
Found at Abnormal Returns www.abnormalreturns.com
9.U.S. Demographics are in Great Shape Versus Rest of G10 Countries.
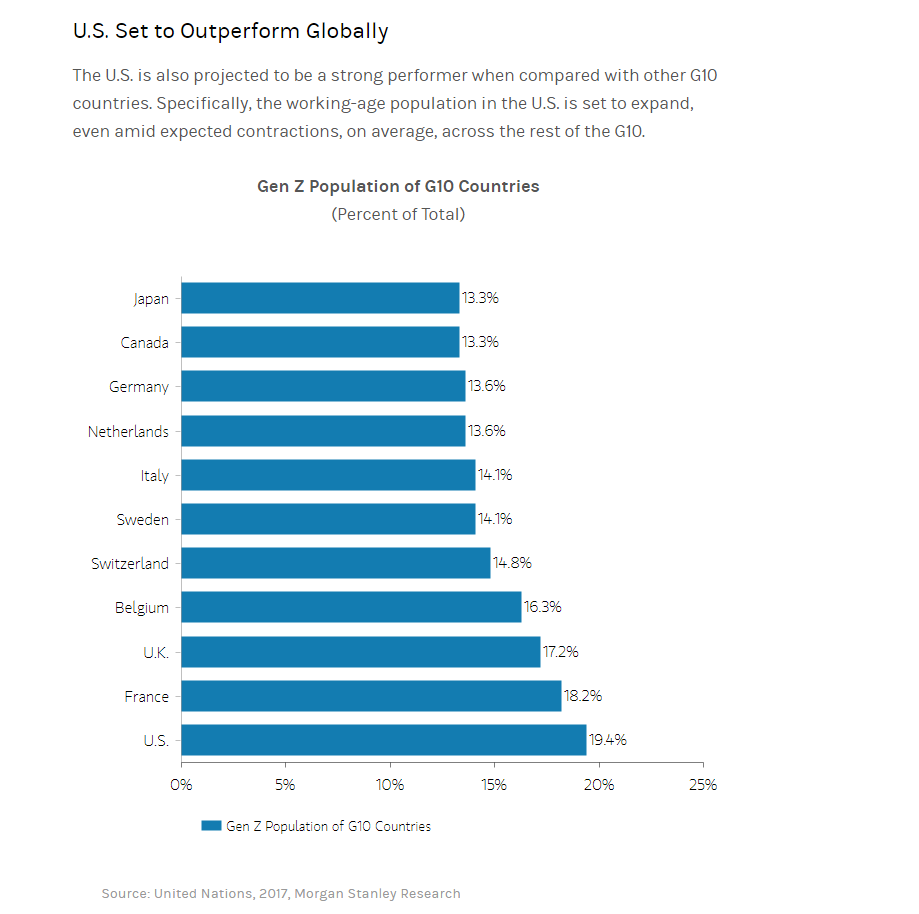
https://www.morganstanley.com/ideas/millennial-gen-z-economy
10.Great Excerpt From Warren Buffett Annual Letter

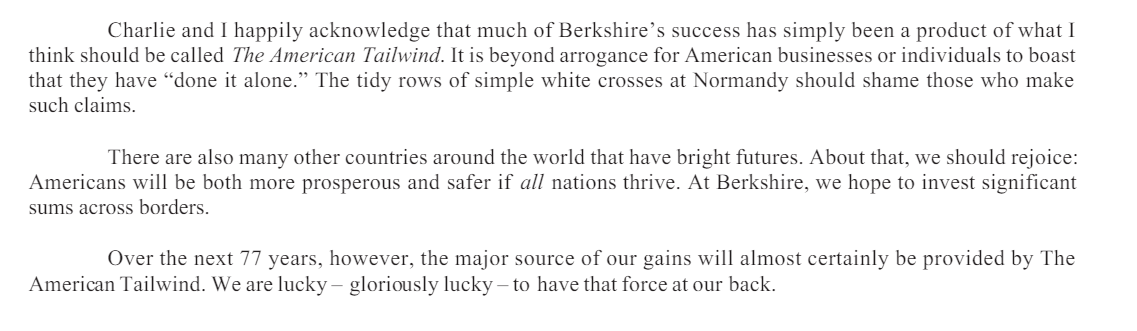
https://www.cnbc.com/2019/02/23/full-warren-buffett-annual-hareholder-letter-read-it-here.html