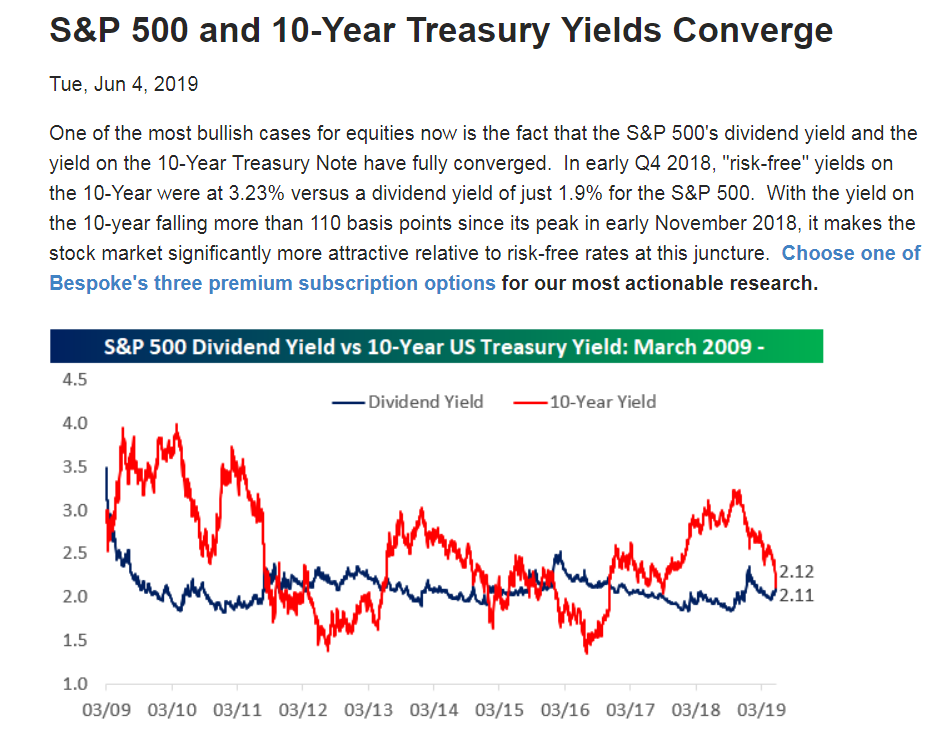
1.S&P Dividend Yield and 10 Year Treasury Yield Converge.
2.Chinese Stocks Trading in the U.S. Plunge.
Wolf Street
US-Traded Chinese Stocks & ADRs Totally Crushed, Many by 50% or 60% or More
by Wolf Richter • May 25, 2019 • 84 Comments • Email to a friend
Bloodletting after record IPO Hype in 2018 of Chinese companies in the US.
There are about 300 Chinese companies that are traded in the US, either on exchanges or over the counter, either as American Depositary Receipts (ADRs) or as shares. And they’re just about all getting crushed, crushed, crushed.
Even Alibaba, the biggie – which has gotten off easy so far. Its ADRs [BABA] fell again on Friday, closing at $155, having plunged 18% in March so far and 26% from the 52-week high.
Weibo [WB], a social media giant, fell 3.8% on Friday to $43.66 and is now down 69% from its peak in January 2018.
Baidu [BIDU] has plunged 26% over the past six trading days alone to $114.47, and is down 58% from its 52-week high.
JD.com [JD], an online retailer, has plunged 48% from its all-time high in January 2018, to $26.32.
Tencent Holdings, the conglomerate with holdings in social media, payments, video gaming, and tech: Its ADRs [TCEHY] have dropped 25% from the 52-week high and 33% from the peak in January 2018, to $40.86.
Sina Corp [SINA], an internet portal, plunged 5.9% on Friday and 37% so far in May. It’s down 67% from the top of the range it traded at in the January-March period of 2018. The shares have traded in the US since its IPO in March 2000, just as the dotcom bubble was starting to blow up. These shares are now down 70% from their all-time high in 2011.
Then there are the Chinese companies that went public in the US via IPOs in 2018. It was a banner year, in terms of the number of companies: 33, the most ever. They accounted for 17% of all IPOs in the US in 2018. By deal size, 2018 was second largest year: $9.2 billion, behind only 2014, the year of Alibaba’s $25 billion IPO.
Here are the four largest IPOs by Chinese companies in the US in 2018, and to what extent their shares have recently gotten crushed:
#1. iQiyi [IQ], the video streaming company that had been hyped in the US as “China’s answer to Netflix.” It went public at an IPO price of $18 a share, giving it a deal value of $2.4 billion. It had a tumultuous ride, first down into the $14-range, then up to $46.23, and then back down to $18.70 on Friday. It has plunged 19% since May 3, 32% since March 18, and is down 60% from its peak.
#2. Pinduoduo [PDD], the online group discounter. The IPO in July 2018, at a price of $19 a share, gave it a deal value of $1.6 billion. Shares fell to $20.28 on Friday, down 35% from the 52-week high in February.
#3. NIO [NIO], EV maker that had been hyped in the US as the “Tesla of China” at the time of its IPO last October, which was when Tesla traded at around $350 a share, not at $190 as on Friday. The IPO price of $6.25 per ADR made this a $1.15 billion deal. These ADRs fell 1.8% on Friday to $3.86, having plunged 38% below the IPO price, and 72% from the peak of $13.80 at max-hype after the IPO.
#4. Tencent Music Entertainment [TME], the music division of Tencent Holdings, has plunged 28% since April 2. In early December, days before the IPO, the IPO was still hyped as “hotly-anticipated.” But it wasn’t so hot. It took place at $13 per ADR, at the bottom of the range indicated, still extracting $1.1 billion from investors. The ADRs reached a high of $19.11 on March 18 and closed on Friday at $13.62, having plunged 29% from their peak.
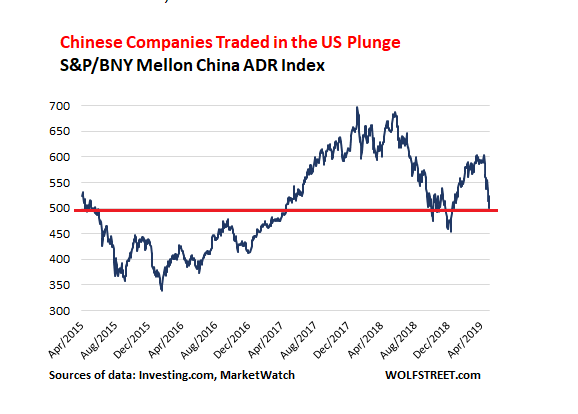
There is an index that tracks US-traded ADRs by Chinese companies, the S&P/BNY Mellon China ADR Index. It closed on Friday at 500.1, down 29% from its peak in January 2018, and down 17% so far in May. The index is dominated by Alibaba’s ADRs. Note the plunge in May to below the level where it had been in April 2015 (data via Investing.com, Friday’s closing price via MarketWatch):
Clearly, all the razzmatazz about the US-China trade war, the “new cold war,” the “tech cold war,” and all the global entanglement around Huawei are not helpful. But there is a lot more to it.
SMIC, China’s largest semiconductor maker, said on Friday in a filing to the Hong Kong stock exchange, where its actual shares are listed, that it had notified the NYSE of its intention to apply on June 3 to delist its ADRs that are traded on the NYSE. The delisting is expected to happen after June 13, whereupon the ADRs will trade on the over-the-counter market, it said according to the South China Morning Post.
Upon the news, its ADRs [SMI] fell nearly 5% to $5.24 on Friday. They’d first started trading in the US in early 2004, reaching a high in April that year of $15.60. For buy-and-holders, this has not been a good ride. In the 15 years since that peak, the ADRs have plunged 66%. And they’re down 40% from November 2017.
The company cited low trading volumes of its ADRs and the high costs of maintaining the listing in the US and complying with reporting requirements and related laws in the US, according to the South China Morning Post – and these US reporting requirements and laws are of course precisely what are supposed to provide investors a modicum of protection against the biggest abuses and scams.
Enjoy reading WOLF STREET and want to support it? Using ad blockers – I totally get why – but want to support the site? You can donate “beer money.” I appreciate it immensely. Click on the beer mug to find out how:
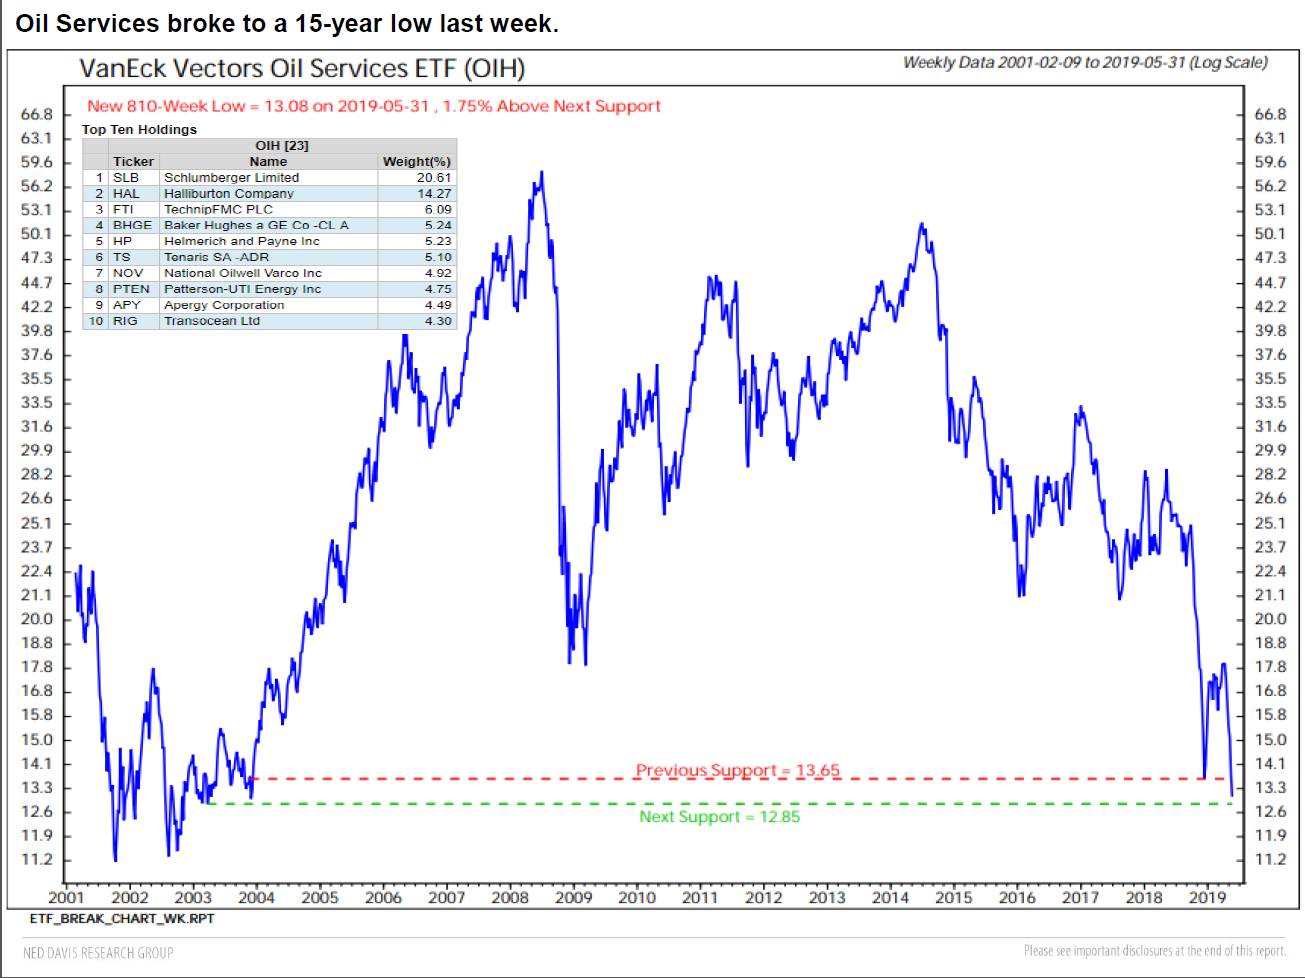
3.Oil Service Stocks Hitting 15 Year Lows.
Ned Davis Research
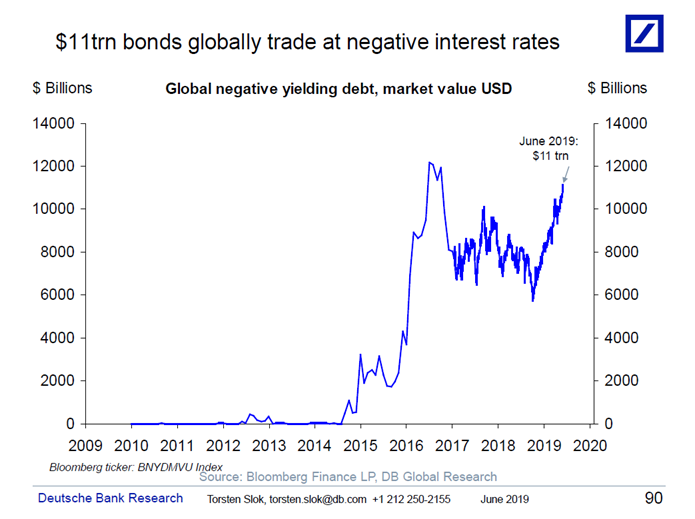
4.Will Negative Yielding Global Debt Breakout to New Highs? We are Close.
There are now $11trn bonds in the world trading at negative interest rates, see chart below and here. This corresponds to roughly 20% of all sovereign and corporate bonds outstanding in the world.
Torsten Sløk, Ph.D.
Chief Economist
Managing Director
Deutsche Bank Securities,
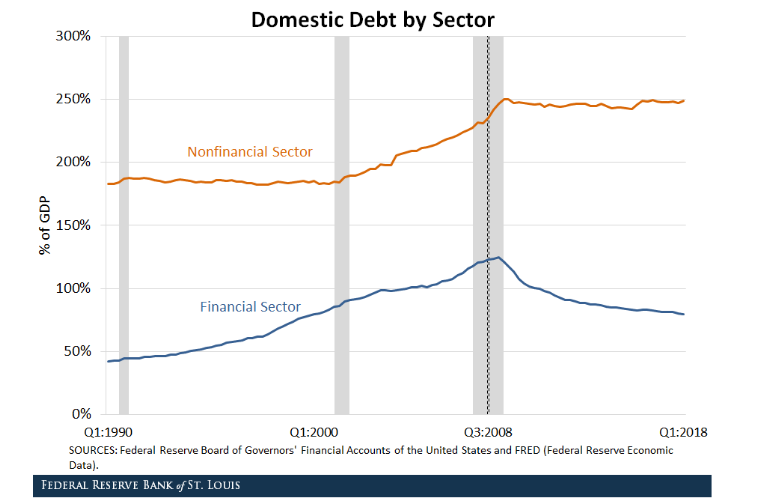
5.Household and Financial Sector Debt Not at Previous Records.
Mr. Rudebusch notes that the hangover from the 2007-09 recession may have restrained the kinds of excesses in the current expansion that led to downturns in the past.
In the past five years, for example, U.S. financial sector debt has increased 9%, compared with a 64% increase in the five years before the last recession. Household debt is up 14%, compared with a 65% increase in the five years before the recession. While student debt and credit card debt has grown, the growth in mortgage debt, which helped spark the last downturn, has been modest in this expansion. Strong debt growth can lead to excessive spending and investment and problems for banks that are owed money that isn’t returned.
By
Jon Hilsenrath
https://www.wsj.com/articles/after-record-long-expansion-heres-what-could-knock-the-economy-off-course-11559591043?mod=itp_wsj&ru=yahoo
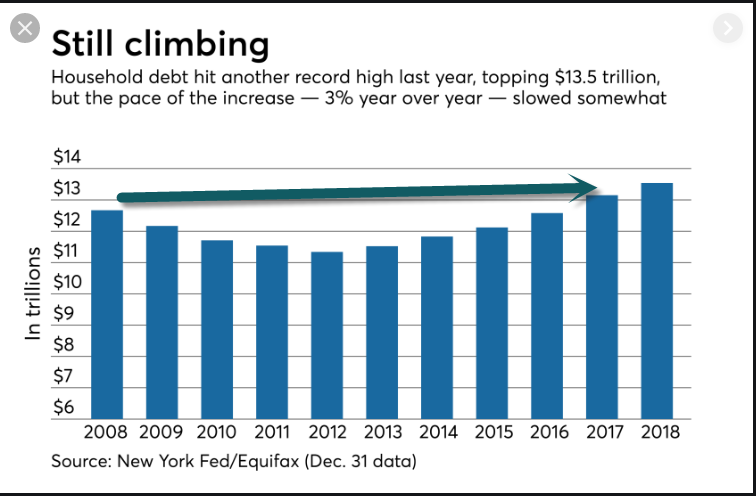
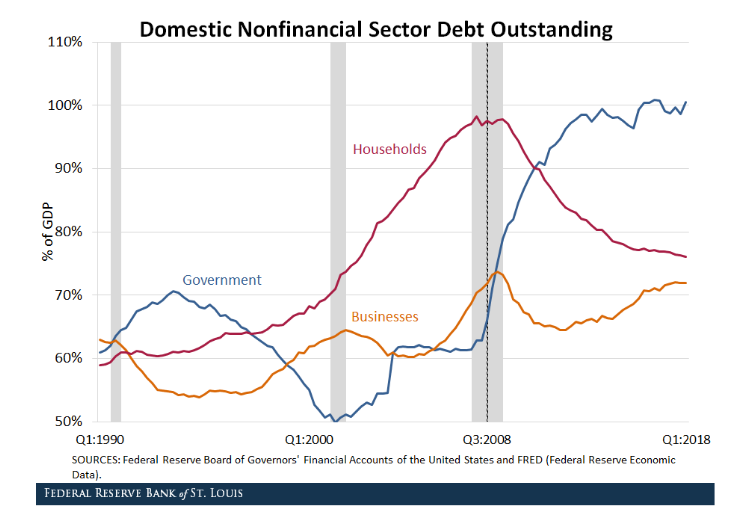
Household Debt Up 14% in the Last 5 Years Compared to 65% 5 Years Prior to Last Recession
U.S. Financial Sector Debt Up 9% in Last 5 Years Versus 64% Prior to Last Recession
https://www.stlouisfed.org/on-the-economy/2018/october/domestic-debt-before-after-great-recession
6 .Toyota Prius Sales Fall Off a Cliff
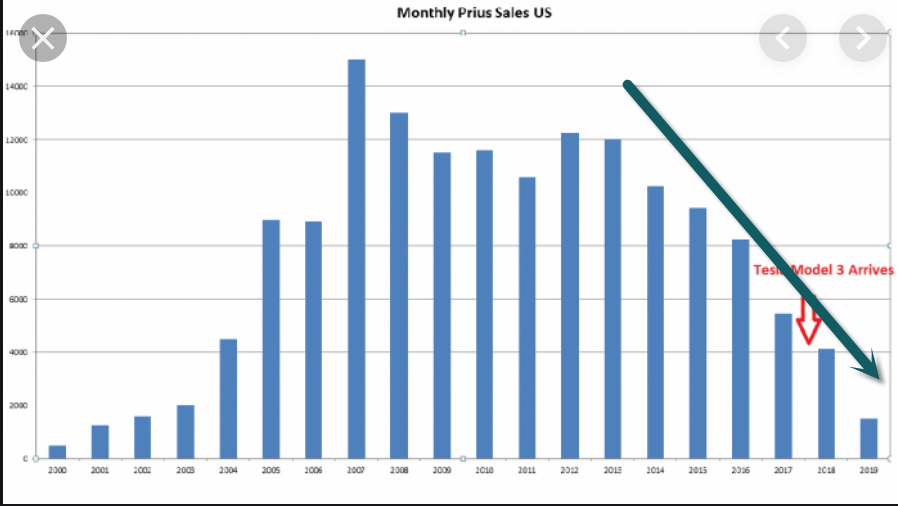
Prius Sales Fell Off A Cliff In January – Was It Tesla, Or Could This Be The Real Reason Why?
Toyota Prius sales declined at the fastest rate in a decade in January. Maybe the reason isn’t what we all assume.
The Toyota Prius has been declining in sales in the U.S. since its high point in 2007. Yes, for over a decade, and since before Tesla was selling cars in any meaningful way, the Prius has been past its peak, as the saying goes. Everyone wants to tell you why this is happening and nobody wants to do any math or research. So, we figured we would run some numbers.
John Goreham G+ Feb 4 2019 – 3:18pm
https://www.torquenews.com/1083/prius-sales-fell-cliff-january-was-it-tesla-or-could-be-real-reason-why
7. Average US Time Spent with Mobile in 2019 Has Increased
US Adults Spend More Time on Mobile than They Do Watching TV
For the first time ever, US consumers will spend more time using their mobile devices than watching TV, with smartphone use dominating that time spent.
Consumers’ use of smartphones will continue to make up the majority of their media consumption, but we predict that use will plateau by 2020, as consumers become increasingly uneasy about overuse of mobile devices.
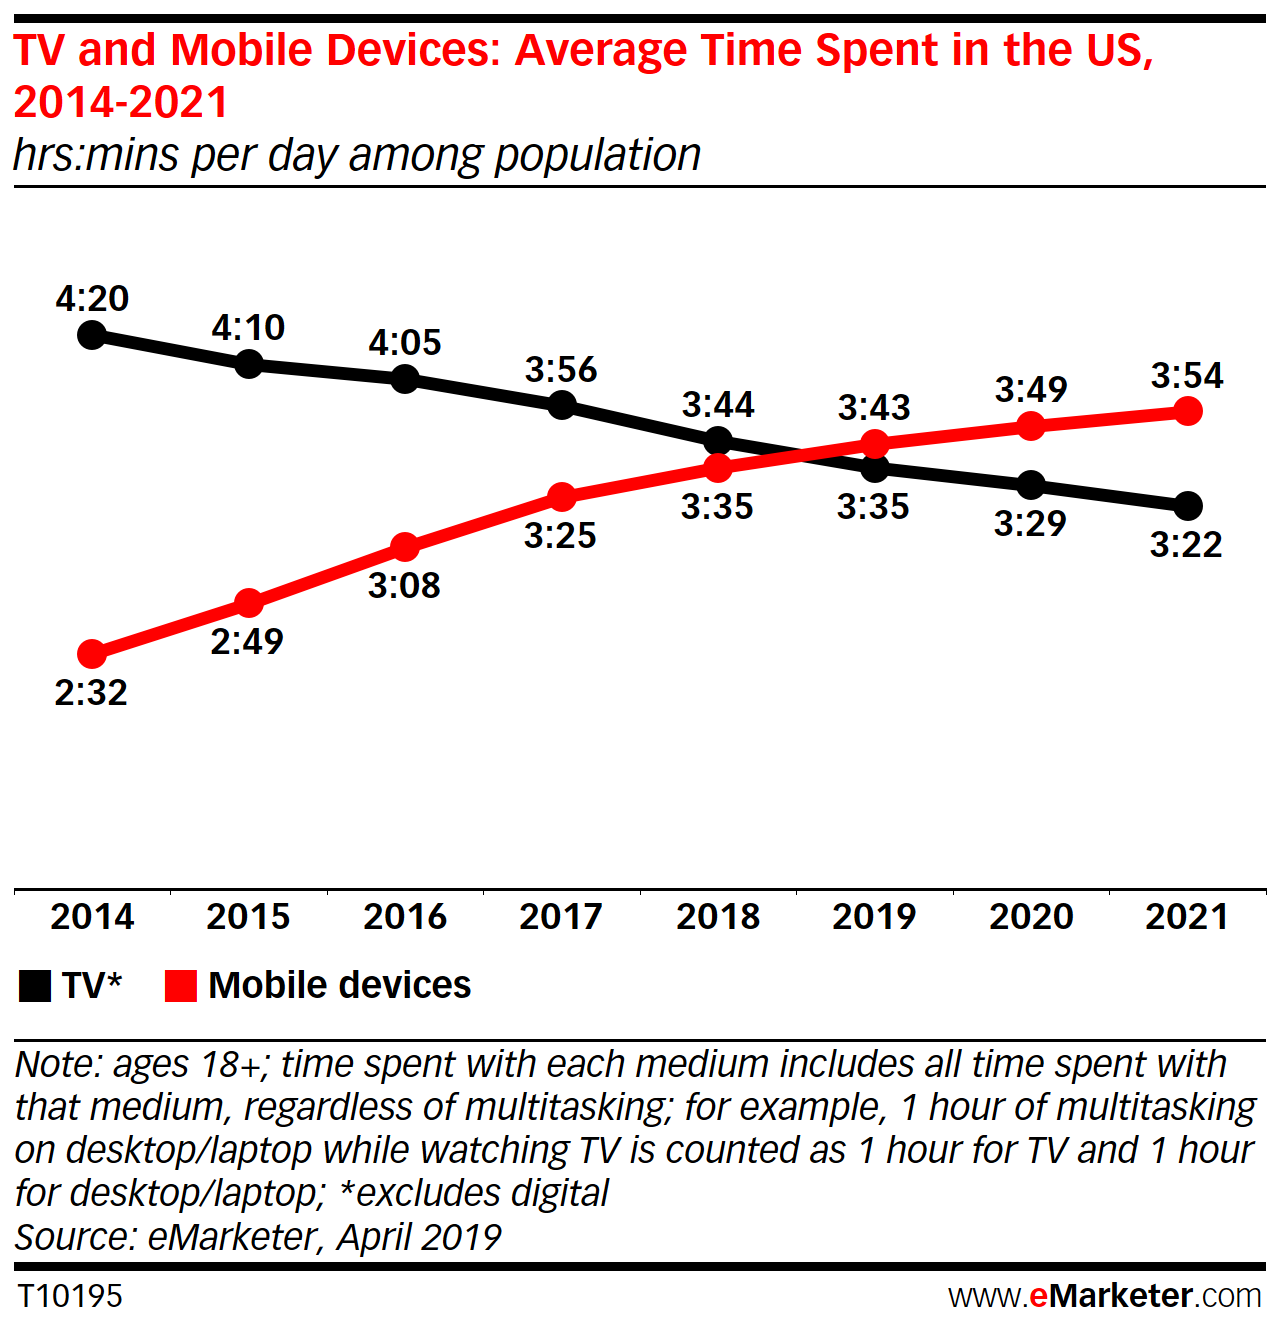
The average US adult will spend 3 hours, 43 minutes (referenced as 3:43) on mobile devices in 2019, just above the 3:35 spent on TV. Of time spent on mobile, US consumers will spend 2:55 on smartphones, a 9-minute increase from last year. In 2018, mobile time spent was 3:35, with TV time spent at 3:44.
Tablet use among US adults continues to lose ground, having peaked at 1:11 daily in 2017 and dipped to 1:08 this year. This trend will continue through 2021.
“We’ve expected that mobile would overtake TV for a while, but seeing it happen is still surprising,” said Yoram Wurmser, eMarketer principal analyst. “As recently as 2014, the average US adult watched nearly 2 hours more TV than they spent on their phones.”
What are people spending time on their devices doing? They’re consistently spending the bulk of their time using apps over web browsers, with the average person spending 2:57 in apps vs. 0:26 on a mobile browser.
Within apps, people spent the most time listening to digital audio, followed by social network activity.
“Digital audio apps continue to add minutes because people are streaming more music on their phones, and podcasts have taken off in popularity in the past few years,” Wurmser said.
Longer term, smartphones will remain the dominant device for consumer media, but backlash continues over screen time, even if broader consumer behavior has not reflected these sentiments. Companies like Google and Apple have introduced screen time controls, but how useful they are in ultimately changing behavior remains to be seen.
https://www.emarketer.com/content/average-us-time-spent-with-mobile-in-2019-has-increased
8.How to Improve Memory: The Scientific Approach
By: SPENCER BROOKS
- This article covers several science-backed ways to improve your memory and get rid of brain fog. The good news is that most of them are lifestyle-based, and you can start them today for free.
- Exercise is one of the best ways to improve memory, especially if you do a workout that boosts brain-derived neurotrophic factor (BDNF).
- Dual N-back training, a special type of brain training you can do for free online, improves working memory and also raises IQ.
- Supplements like forskolin and bacopa improve memory as well.
Memory is a valuable part of high performance. Improving your memory will help you learn faster, and getting rid of brain fog will make you more effective at work. Memory will even improve your social skills, especially if you’re prone to forgetting names or faces.
And, of course, taking care of your memory wards off cognitive decline as you age, keeping you mentally quick and independent well into the golden years of your life.
There are a few different ways to improve your memory and keep it strong. The good news is that the most powerful ones are lifestyle-based, and you can start them today for free. Download this printable checklist on the best ways to improve your memory.
https://blog.bulletproof.com/improve-memory-170419/