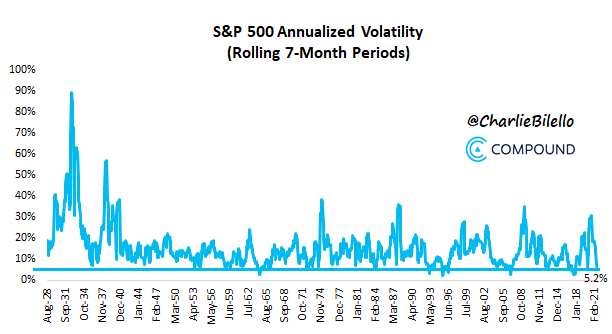
1. S&P Volatility Lower than 98% of Periods Going Back to 1928
Charlie Bilello-The S&P 500 has posted a positive return in each of the last 7 months (February – August), and has done so with bond-like volatility (5.2% vs. 5.2% historical average for the Bloomberg Barclays Aggregate). This is lower than over 98% of historical periods going back to 1928.
2. Netflix Breaks Out of One-Year Sideways Pattern

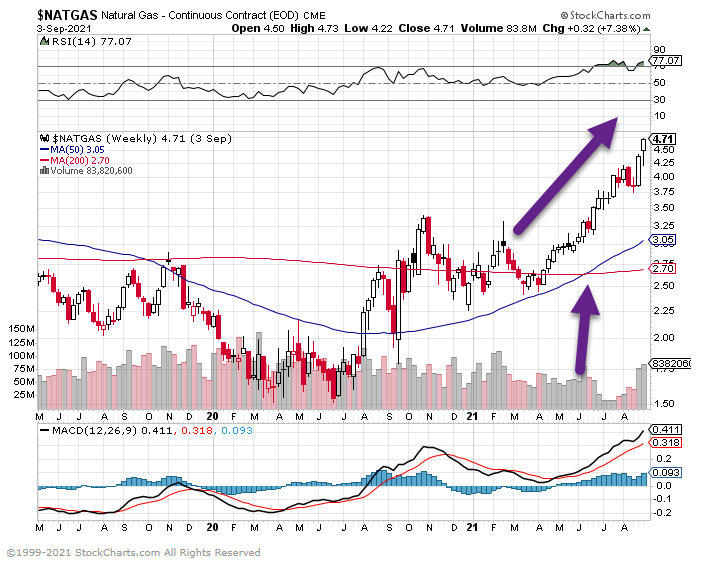
3. Natural Gas Breakout….Up Almost 100 Since Spring.
Natural Gas 50 day thru 200 day to upside.
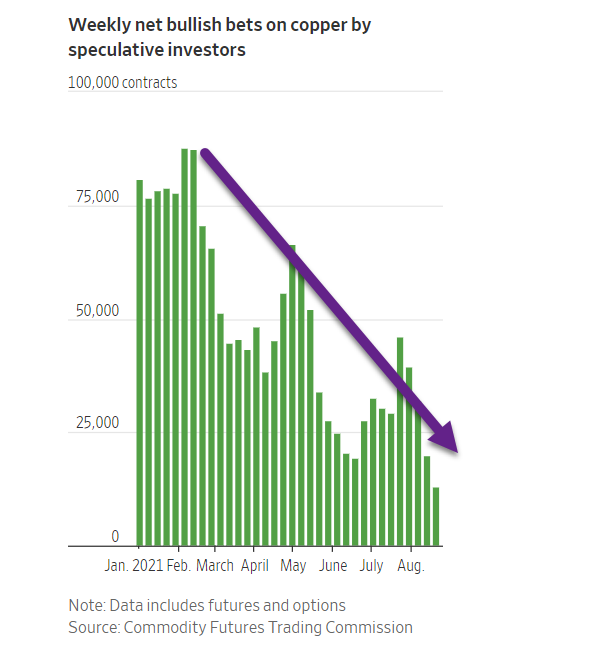
4. Bullish Bets on Copper Hit One-Year Lows
Net bets on higher copper prices by hedge funds and other speculators slid to 12,956 contracts during the week ended Aug. 24, the lowest level since June 2020 and down roughly 85% from the start of the year, Commodity Futures Trading Commission data show. The CFTC data measure futures and options, which are commonly used by professional investors to wager on price movements and by producers to hedge against volatility.
5. Follow Up on Fidelity Hiring 9000 Employess…8x Increase in Client Facing Roles.

6. MEMX New Market Exchange Increasing Market Share
Highlights & Recent Developments
· Market share hit an all-time record of 3.95% on August 30th
· MEMX became the 5th largest exchange for ETPs, with market share of 4.1% in August, including a record 4.6% share on August 18 and 5.0% share in SPY on August 17
· Market share and NBBO quoting time grew significantly in S&P 500 stocks
· Data on realized spreads (trade-to-mid markouts) and quote stability shows MEMX compares favorably to the largest maker/taker exchanges
· New blog post: Read why MEMX submitted a request to the SEC to quote at .005 increments in tick constrained names
Market Share
Market share climbed to new highs for the month, hitting an average 3.4% total market share and 5.9% on-exchange market share. MEMX closed out August with a 5-day moving average 3.5% total market share and 6.3% on-exchange market share.

MEMX market share in S&P 500 stocks climbed a full percentage point, from 2.4% on July 30 to 3.4% on August 30. Higher average time quoting at the NBBO in S&P stocks was a key contributor.

7. The Last U.S. Government Surplus was 2001….2021 Deficit So Far $2.54 Trillion
The Lead Lag ReportThe U.S. government…It does really well on the spending part, but not so much on the earning part. We’ve gotten so used to the idea of the government running an annual deficit that we don’t even blink at the notion any more. The fact is that the government hasn’t run a budget surplus in 20 years and the annual deficits are growing larger.
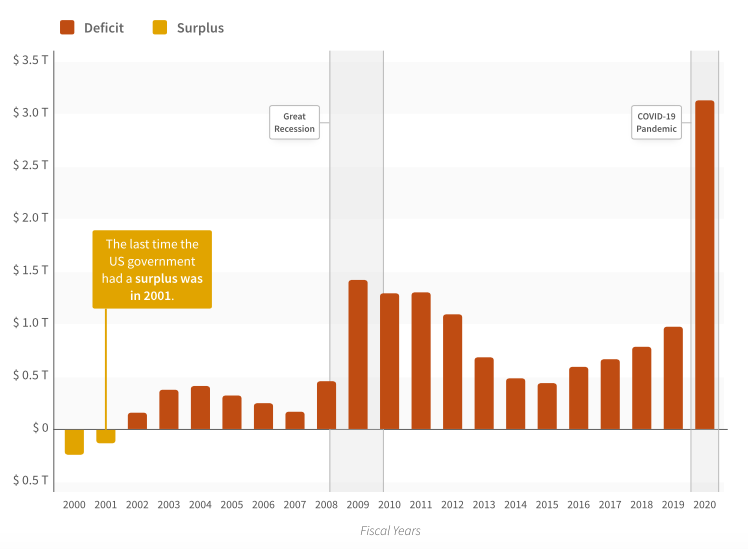
The biggest budget deficits were, of course, around the financial crisis and the COVID pandemic. During the housing collapse, the government spent trillions bailing out the banks and buying up degraded mortgages in order to clean up the balance sheets. The pandemic featured trillions of dollars in stimulus payments and small business loans. Over the past several years, annual budget deficits steadily grew throughout the year, finishing somewhere between $500 billion to $1 trillion. As the pandemic recession began, the deficit grew quickly and has been steadily and significantly climbing ever since.
However, it would be incorrect to assume that those were the only two events over the past 15 years that have required increased government spending. In the earlier graphic, we saw annual deficits come down after the financial crisis, but they remained elevated compared to historical averages, both in absolute terms and in terms of debt/GDP.
https://www.leadlagreport.com/
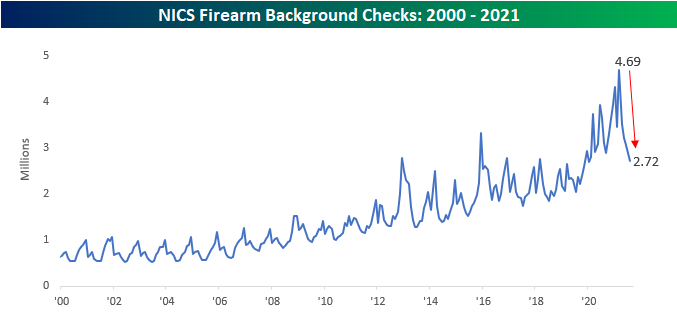
8. Gun Background Checks Return to More Normal Range
Bespoke Investment Group-In a sign that overall levels of anxiety across the United States may be receding, the pace of background checks for the purchase of firearms has come crashing down from record-high levels. From a peak of 4.69 million in March, background checks fell to 2.72 million in August. That level is still the second-highest total for the month of August on record, but after a steady surge with the onset of COVID and the riots across the country last summer, there has been a sharp decline in total checks over the last few months.
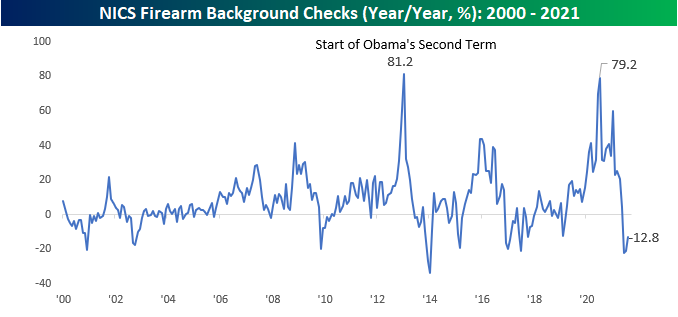
On a y/y basis, background checks have really swung from one extreme to the other. From last July to this June, total background checks experienced a 100 percentage point peak to trough swing falling from 79.2% down to a decline of 22.3%. Over the last two months, the rate of decline has gotten less bad, but it is still at negative 12.8%.
9. Can You Still Afford a Mortgage?
NY Times-Rising home prices have increased income requirements for mortgage qualification.
With the quick escalation of home prices during the pandemic, it’s become increasingly difficult to qualify for a typical mortgage. This week we return to the quarterly report from HSH.com, which breaks down the annual income required to qualify for a mortgage in the country’s 50 largest metropolitan areas.
Using 2021 second-quarter sale price data for single-family homes from the National Association of Realtors (NAR), and factoring in the industry standard 28 percent debt-to-income ratio to qualify prospective borrowers, the report determined the income required for a mortgage in each area. (A 20 percent down payment and a fixed-rate, 30-year loan at current rates were assumed, and local property taxes and homeowner’s insurance costs were included.)
NAR’s national median sale price in Q2 2021 was $357,900, roughly 22 percent higher than a year earlier. At that price, an annual income of $68,032 would be required to qualify for a mortgage, with a monthly payment of $1,587.
Most affordable was Pittsburgh, where the median sale price of $175,000 required an income of $38,275 and monthly payments of $893. San Jose, Calif., with a median sale price of $1.699 million, required the highest income, $286,703, with a monthly payment of $6,690.
This week’s chart shows what you’d need to earn in the 10 most affordable and 10 least affordable metros, and what your monthly loan payment would be in each.

10. How We Become Liberal or Conservative
Marty Nemko Ph.D. Psychology Today.
Knowing the forces that act on us can free us to choose.
KEY POINTS
- Genes, peers, parents, teachers, professors, media, and spiritual institutions all affect our political leanings.
- More than half of our political leanings are affected by our environment, which allows us to alter our views.
- Making even incremental changes can enable us to fairly consider new political viewpoints.

A number of forces likely lead us to become liberal or conservative. Being aware of them can help us decide which to welcome and which to devalue.
Genetics. Genes matter. A 2020 review of the literature by NYU and University of Wisconsin researchers found that “Twin studies and more sophisticated approaches that have now emerged, consistently show that ideology is about 40 percent heritable.”
Peers. Of course, peers affect our views. For example, a study by University of Calgary researchers found that “Discoveries of political group membership may influence the development or maintenance of friendships.” In other words, we tend to make and develop friends with people like us, thereby creating an ideological bubble, whether liberal or conservative.
Parents. Your parents, without proselytizing or even mentioning politics, can influence our political views. A 2020 Scientific American review of the literature concluded, “The research shows that conservatives desire security, predictability, and authority more than liberals do.” So, parents who are laissez-faire may lead their child to be a bigger risk-taker and hence be more likely to become liberal. Conversely, a cautious parent may be more likely to convey to a child that change, on average, is unwise and thus, the child is more likely to become conservative.
Teachers and professors. Even in elementary school but especially in high school and college, many teachers and professors, consciously or not, inculcate conservative and, more often, liberal values. For example, a review of the literature by a self-described right-of-center professor at Sarah Lawrence College and a left-of-center one at Carleton College, “unequivocally show that liberals are considerably overrepresented on university and college campuses. And the research on campus climate reveals a decrease in openness to non-liberal viewpoints.”
But does that actually affect students’ political views? To address that question, a survey of 3,486 students by Ohio State University and North Carolina State University researchers found, “Over four years of college, students develop positive attitudes for political liberals but not conservatives.:” And it doesn’t always start in college—some evidence suggests that this shift can, in some cases, start in high school or earlier.
Media. Whether the media was ever unbiased is unclear, but most of today’s media certainly has a perspective, whether toward the left or right. If you consume mainly conservative media, it likely will make you more conservative and vice versa.
Spiritual influences. Religious institutions range from fundamentalist right-wing to radical leftist, as reported by a Pew Research Center’s survey.
The Takeaway
While 40 percent of our political leanings may have genetic roots, that leaves more than half to the environment. As you consider the factors above, are you satisfied with your influencers? Or would you like to change them, if only modestly, so you can more easily consider multiple perspectives?
I read this aloud on YouTube.
https://www.psychologytoday.com/us/blog/how-do-life/202109/how-we-become-liberal-or-conservative