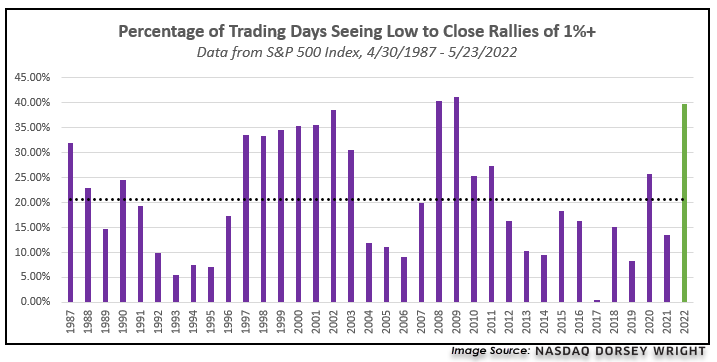
1. 40% of Trading Days this Year 1%+ Moves…2008 Levels
Nasdaq Dorsey Wright-A major portion of the trading days so far this year have seen SPX move at least 1% higher from its daily low into the close, with the count at 39 days through market action Monday. This equates to 39.80% of the days. which is significantly more than the average dating back to April 1987 at about 20.64% of the days. This also puts us on the highest pace of trading days with such a move since 2009. The only other year to see such a high pace of 1% intraday rallies came in 2008. We saw a significant count of intraday rallies from 1997 through 2002, although none of those years reached the current pace. The year with the lowest percentage of large rally days was 2017, which saw only one such day throughout the entire year.
https://www.nasdaq.com/solutions/nasdaq-dorsey-wright
2. Another 2008 Number….Max Pessimism–Percent that Expect “stronger economy” Lower than 2008
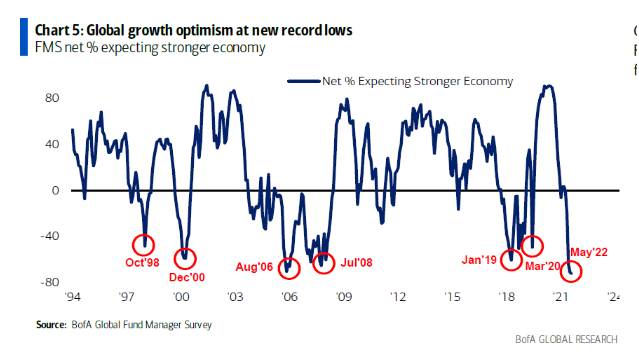
From Irrelevant Investor Blog https://theirrelevantinvestor.
3. History of 7 Week Sell Offs.
Don’t Panic! What History Tells Us After 7 S&P 500 Losing Weeks-The S&P 500 has fallen for seven weeks. Here’s why you don’t want to panic now. BRET KENWELL
Seven straight weekly declines is a pretty rare occurrence. This is just the fourth time we’ve seen such a streak since 1928. The prior three scenarios occurred in 1970, 1980 and 2001. Interestingly, all four declines concluded either in March or May.
To little surprise, there is good news and bad news associated with the declines.
The bad news: In two of the three declines, the seven straight weeks of declines turned into eight straight weeks of declines (in 1970 and 2001).
Further, in both of those years, the market went on to retest the lows, although the time it took varied widely. After the bottom in 1970, the S&P 500 went on to break the low about 4 1/2 years later, in Q4 1974. In 2001, the index broke to new lows a little more than six months later following the 9/11 attacks.
The good news: Each downtrend of this magnitude (seven straight weeks or more) has marked the low for at least six months. Further, the longest stretch did not exceed eight straight weeks.
The “tldr” is we may endure more short-term pain, but we also could be near an intermediate or potentially even a long-term bottom.
|
S&P 500’s Performance From the Low After 7+ Straight Weeks of Declines |
||||
|
4 Weeks Later |
1 Quarter Later |
6 Months Later |
1 Year Later |
|
| 2001 | 15.4% | 13.3% | 4.8% | 6.2% |
| 1980 | 11.6% | 23% | 32.5% | 42.9% |
| 1970 | 7% | 19.3% | 22.75% | 45% |
For instance, following the low after each stretch of seven or more consecutive weekly declines, the S&P 500 was higher four weeks later, one quarter later, six months later and one year later. That’s promising.
In 2001 we had a nice initial burst off the lows, climbing 15.4% a month later and 13.3% one quarter later, although those gains faded a bit once we got to the 6-month and 12-month marks.
https://www.thestreet.com/
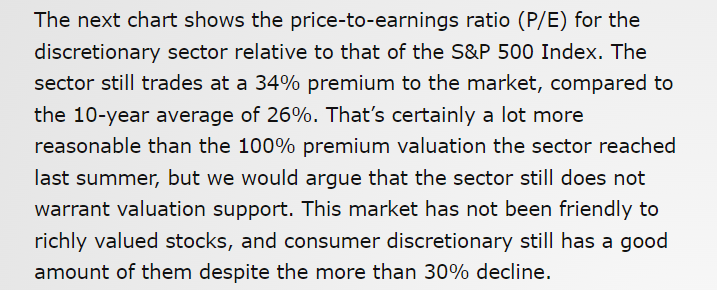
4. Big Correction in Consumer Discretionary but Still Trading at Premium vs. Historical
LPL Research
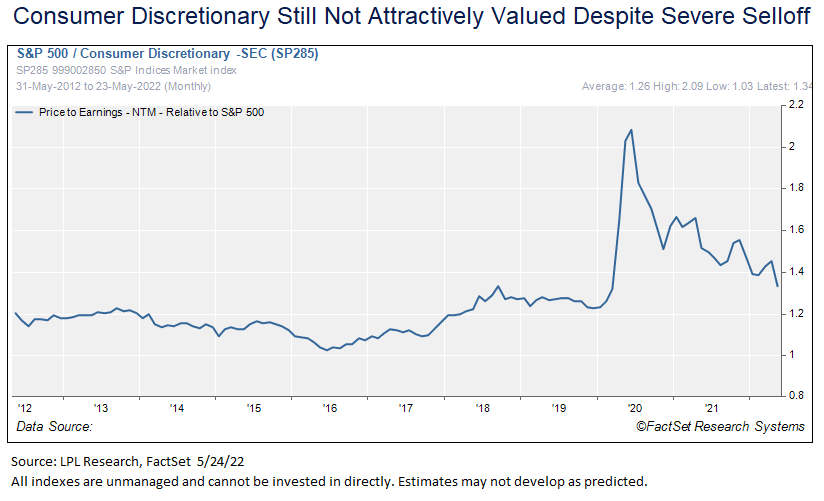
https://lplresearch.com/2022/05/25/difficult-outlook-for-consumer-discretionary/
5. Factor Returns Year to Date
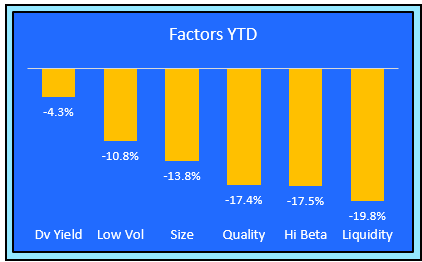
https://www.zeninvestor.org/wp-content/uploads/2022/05/factors.png
6. Supply Bottlenecks Disappearing
United States: Supply bottlenecks are disappearing, which means suppliers will have a tough time raising or even maintaining prices.
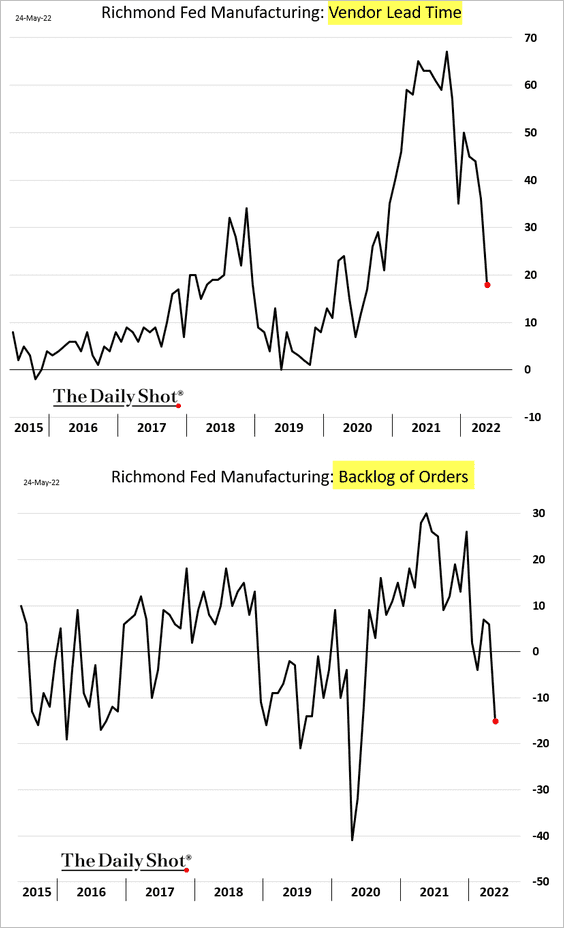
Source: Daily Shot
The Daily Shot https://dailyshotbrief.com/
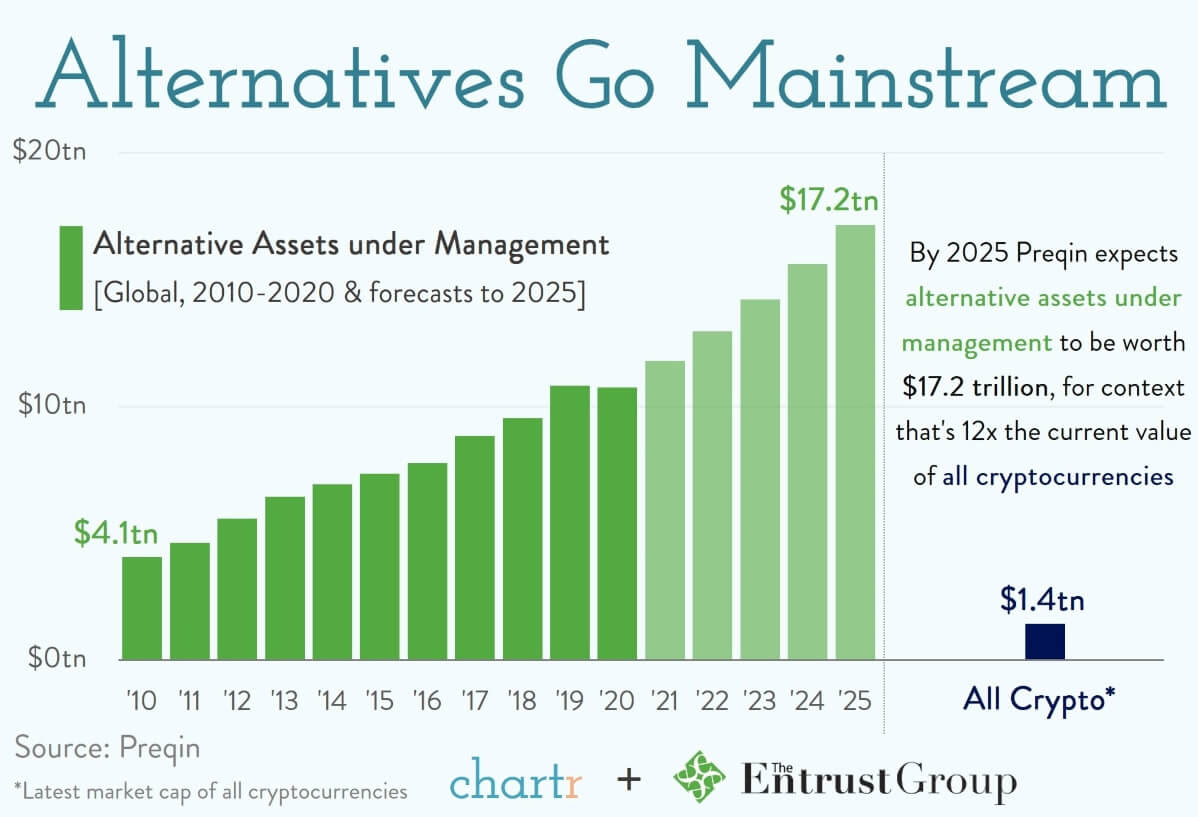
7. Alternative Investments Go Mainstream
8. CO2 Admissions and Commodities
From Michael Gayed Lead Lag Report
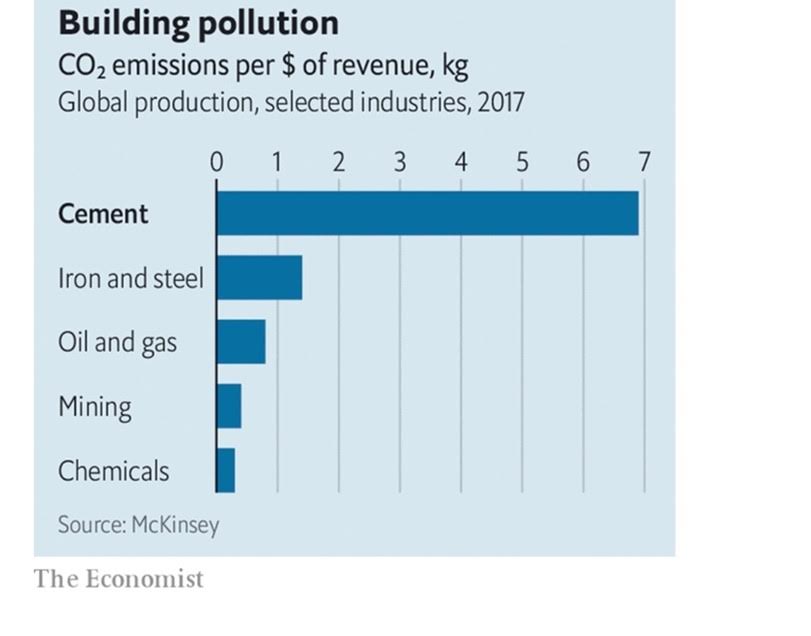
https://twitter.com/leadlagreport/status/1529540557202153473/photo/1
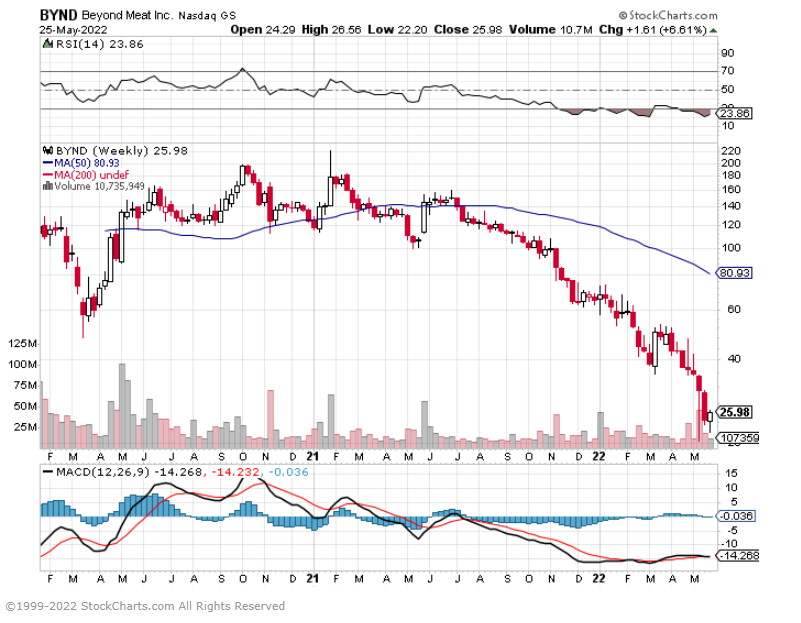
9. Another Covid Chart…Beyond Meat $200 to $25
10. The 15 Rules Every Stoic Must Follow
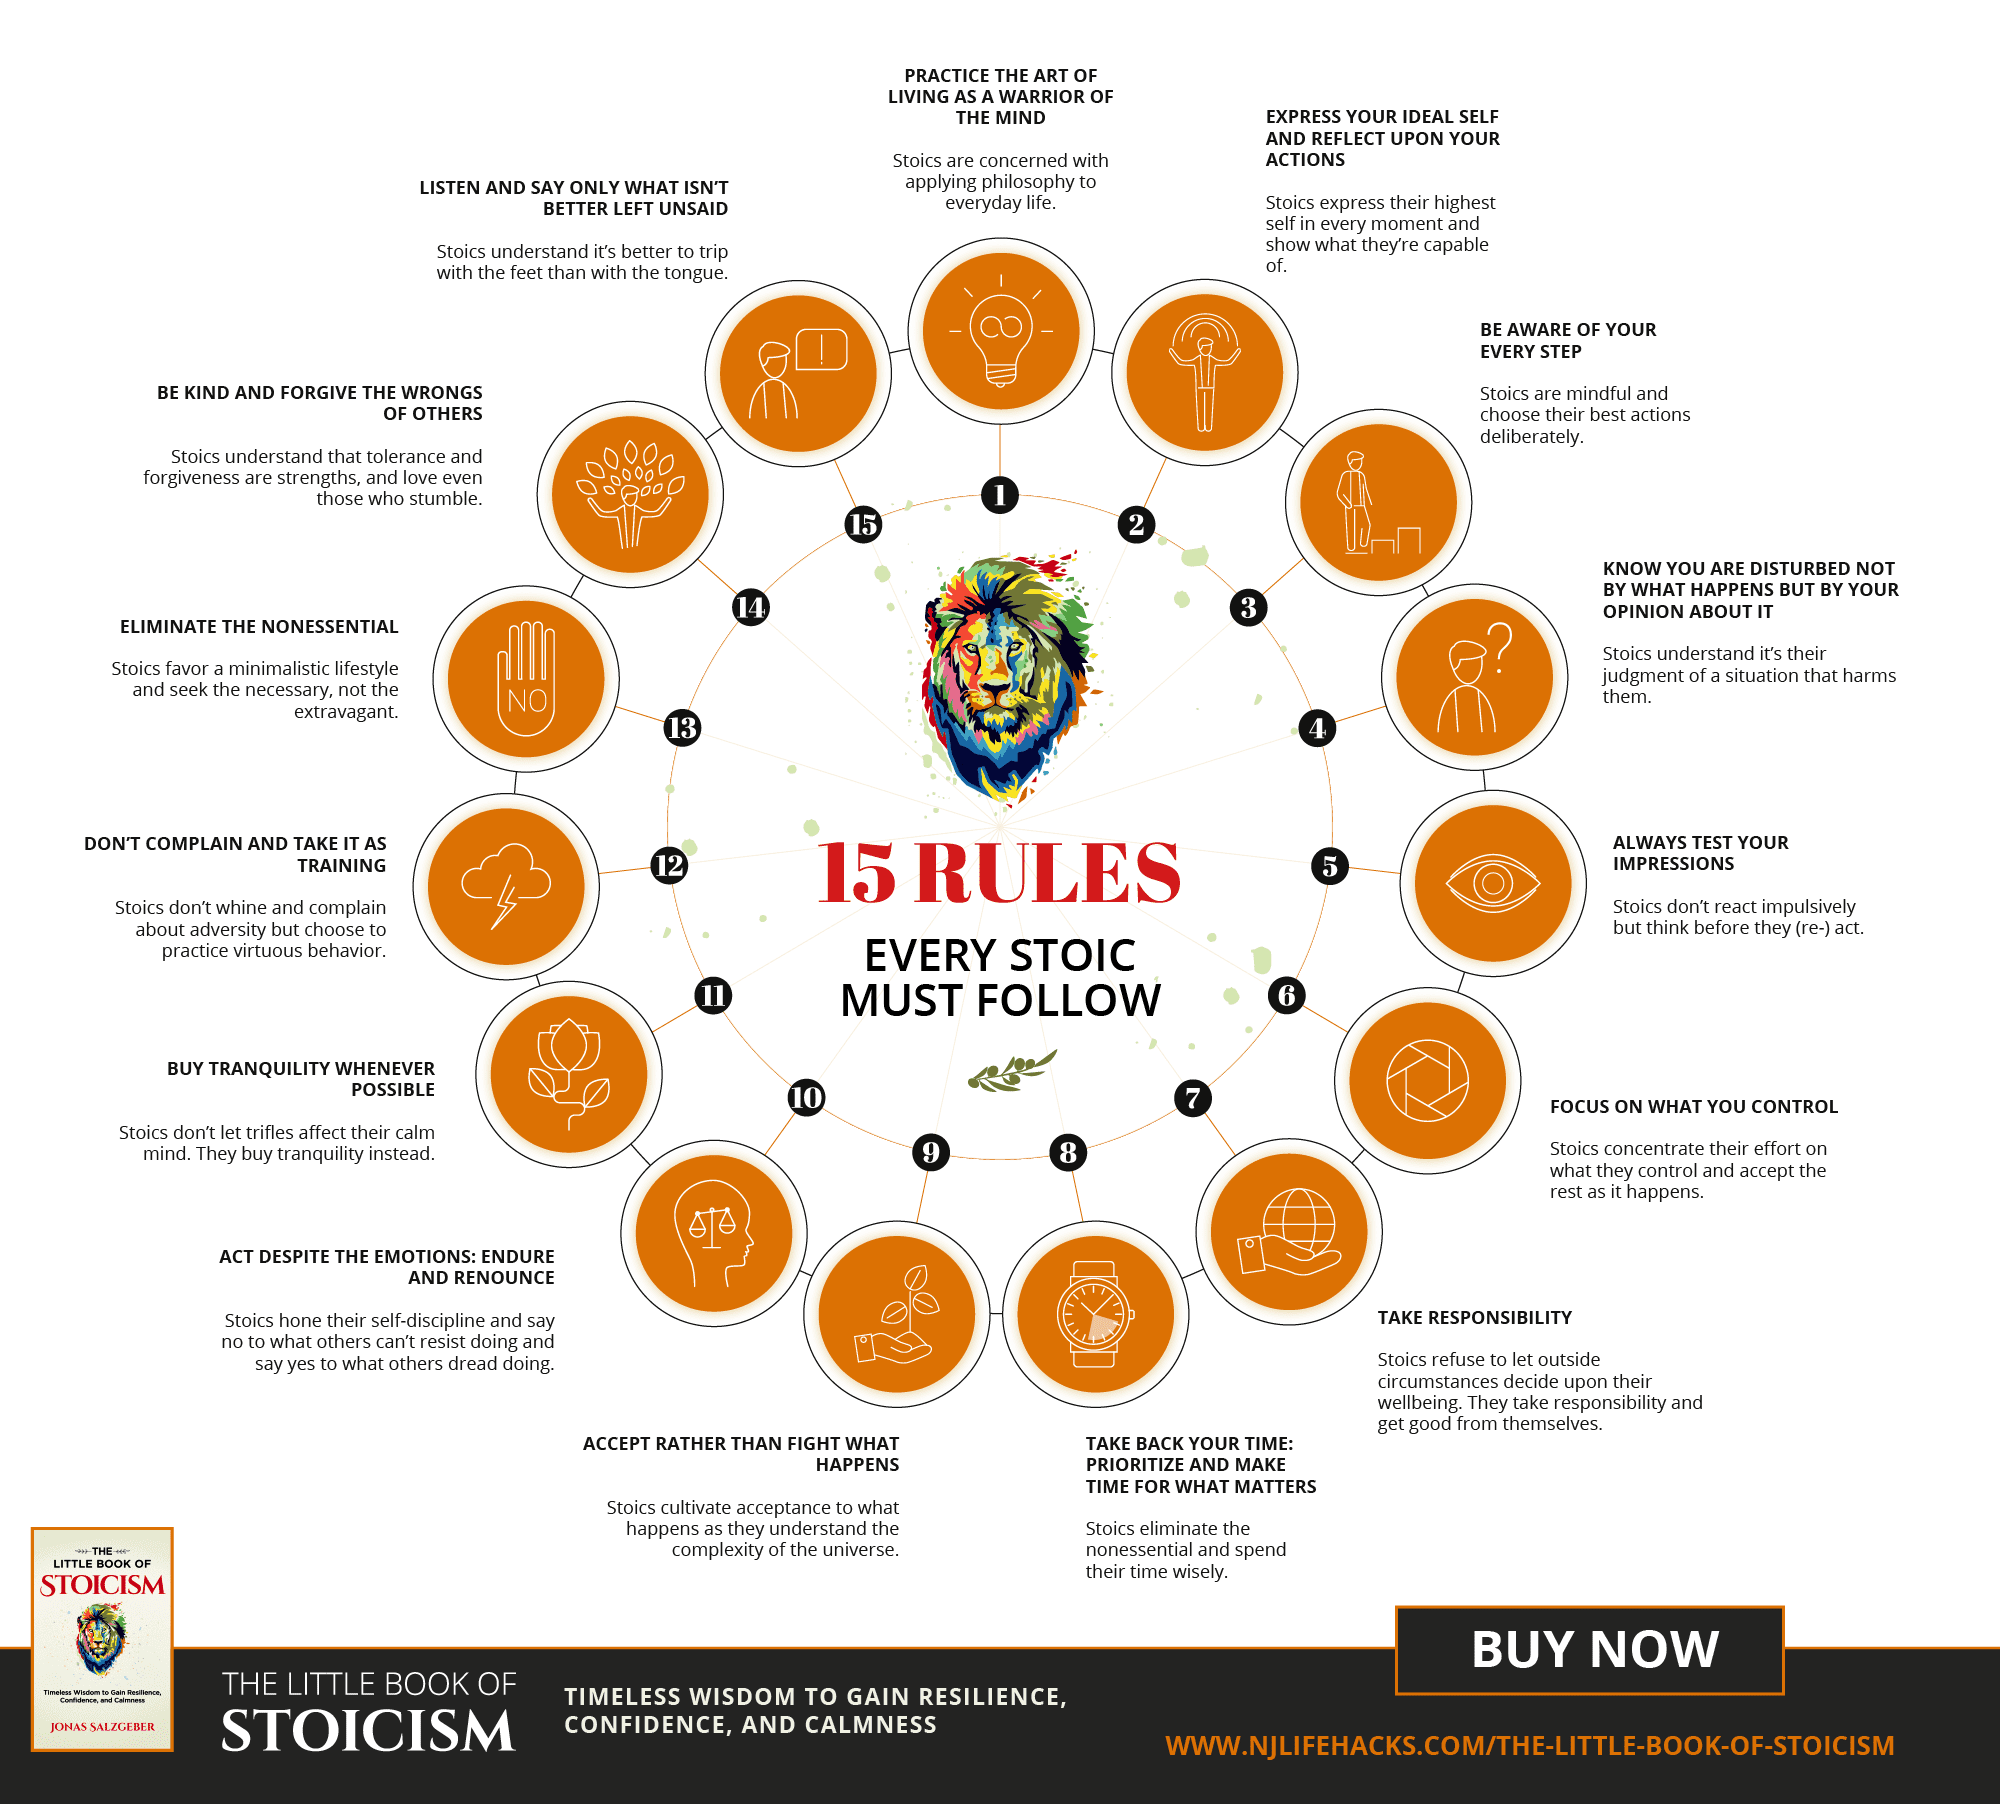
https://www.njlifehacks.com/wp-content/uploads/2019/01/16-Rules-Every-Stoic-Must-Follow-Infographic.png