1.Bitcoin Plunged $6000 Sunday Night.
Zerohedge
Bitcoin has plunged over $6000…

Source: Bloomberg
Update (1540ET): The Dip-buyers stepped in at $35k…

The $35k to $38k strike level also happens to dominate options open interest…
Notably, Coinbase – the largest crypto exchange – is currently offline (for the second time in 3 days).
* * *
Cryptocurrencies are getting clubbed like a baby seal this afternoon as it appears The Economist ‘curse’ has worked once again.
This hit late last night…
https://www.zerohedge.com/crypto/cryptos-are-crashing
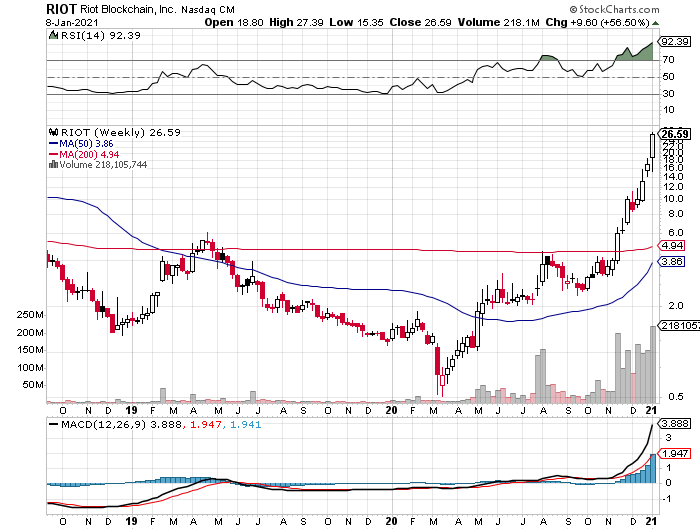
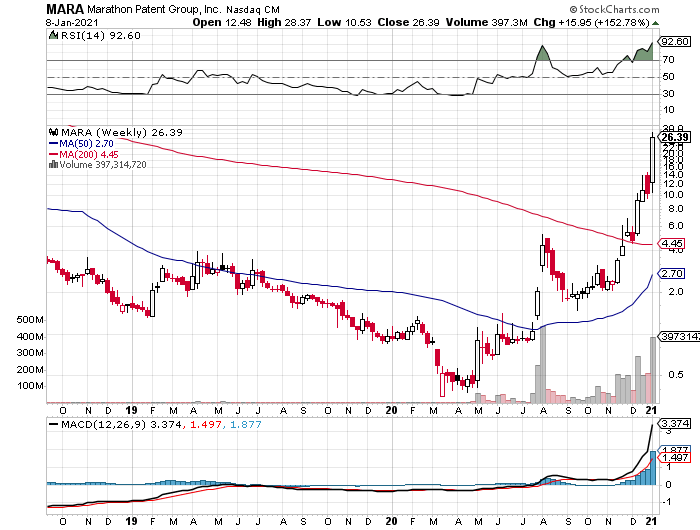
2. U.S. Based Bitcoin Data Miners Up 7-9x in Two Months.
Barrons–Cheap electricity isn’t the only metric anymore. Investors are also weighing regulatory risk and management quality, says Michel Rauchs, who follows cryptocurrencies for the Cambridge Centre for Alternative Finance. “Better-capitalized firms are building out professionalized data centers,” he says. “China has lost some share, particularly to the U.S.”
Stockpickers are certainly enthusiastic about early movers like Marathon Patent Group (ticker: MARA), which mines in Montana and North Dakota. Its shares have exploded ninefold in the past two months. Competitor Riot Blockchain (RIOT), out of upstate New York, is up a mere seven times.
Most Bitcoin Is Made in China. Competitors Are Chipping Away.- Craig Mellow
RIOT Blockchain
©1999-2021 StockCharts.com All Rights Reserved
MARA Patent Group
©1999-2021 StockCharts.com All Rights Reserved
3. AMZN Trading at 15x Cash Flows 5 Years Out…..BABA at 11x Cash Flow 5 Years Out….TSLA 100X Cash Flow 5 Years Out.
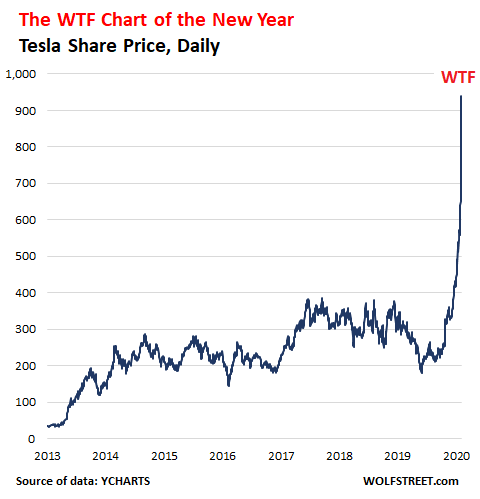
https://seekingalpha.com/article/4352996-teslas-double-wtf-chart-of-year
4. Automakers Capex vs. Tesla
Norway, the testbed for the future of EV, is shooting for zero-emissions by 2026, and is already up to over 50% share for sales of fully electric vehicles. The No. 1 seller? Not a Tesla. It’s the Audi e-Tron.
VW-owned Audi sold 20% more of these e-Trons in Norway in 2020 than Tesla sold Model 3s. The VW ID.3 sold as well as the Model 3. In fact, of the total battery electric vehicle market in Norway, the Tesla Model 3 has just a 10% share.
The Model Y launch should improve their share in 2021, but there are a host of competing products launching soon as well. It is possible that a lot of Tesla investors do not realize the competitive dynamics, whether in Norway, or globally.
Read: Boris Johnson wants a Green Industrial Revolution that bans new petrol cars, adds jobs
Meanwhile, Volkswagen would like nothing more than to destroy demand for Teslas, country by country. In this quest, VW will spend $20 billion on capex annually, over four times what Tesla spends. And Volkswagen is not alone.
Opinion: I’ve pulled out all the stops for Tesla — but can’t find the upside on the stock
By Andrew Dickson

Source: Albert Bridge Capital
5. In U.S. Pickups Dominate
Pickup trucks dominate America’s 10 best-selling vehicles of 2020
KEY POINTS
· Led by the Detroit automakers, pickup trucks accounted for five of the industry’s 10 best-selling vehicles in 2020.
· Ford’s F-Series pickup remained America’s best-selling vehicle for the 39th straight year. It’s also the industry’s top-selling truck for 44-consecutive years.
· The three top-selling pickups accounted for about 13% of the 14.5 million vehicles estimated to have been sold last year in the U.S.
#1-2021 Ford F-150 Limited
Ford
Look no further than the automotive industry’s best-selling vehicles of last year as proof of America’s love for pickup trucks.
Led by trucks from the Detroit automakers, pickups accounted for five of the industry’s 10 best-selling vehicles in 2020 despite their increasingly higher prices and the coronavirus pandemic.
Ford Motor’s F-Series truck retained its decades-long sales dominance, followed by pickups from General Motors and Fiat Chrysler. The three top-selling pickups accounted for about 13% of the 14.5 million vehicles estimated to have been sold last year in the U.S.
“Pickup trucks have been very successful. They have marched through this pandemic so well,” Jessica Caldwell, executive director of insights for auto research firm Edmunds, told CNBC. “They have boosted up all of their respective companies. Particularly the Detroit companies, they have kept business afloat fairly well.”
As sales to commercial and other fleet customers came to a grinding halt during the coronavirus pandemic, automakers touted retail consumers purchasing pickups as quickly as they could produce them in 2020. The companies are still attempting to resupply inventories following a roughly two-month shutdown of their North American plants last spring due to the coronavirus pandemic.
2020 auto sales numbers, with Ford on tap
“It was astonishing. It was like pulling a rabbit out of a hat. I think the automakers were magicians basically in selling trucks this year,” said Jeff Schuster, LMC Automotive president of the Americas. “It was a remarkable year for trucks.”
Ford’s F-Series, which includes the F-150 and its larger siblings, remained America’s best-selling vehicle for the 39thstraight year and the industry’s top-selling truck for the 44th consecutive year. GM’s Chevrolet Silverado regained its silver medal position after dropping to third in 2019 behind Fiat Chrysler’s Ram pickup.
Newcomers to the 10 best-selling vehicles last year included GM’s GMC Sierra as well as the Toyota Tacoma, which outsold the Toyota Corolla compact car. Falling off the sales leaderboard compared to 2019 were the Corolla and Nissan Rogue, which ranked sixth in 2019.
Here’s the full list of America’s 10 best-selling vehicles in 2020:
1. Ford F-Series (Sales of 787,422 units, down 12.2% compared to 2019)

Ford CEO Jim Farley takes off his mask at the Ford Built for America event at Fords Dearborn Truck Plant on September 17, 2020 in Dearborn, Michigan.
Nic Antaya | Getty Images
2. Chevrolet Silverado (594,094, up 3.2%)
Boss
Source: General Motors
3. Ram pickup (563,676, down 11%)
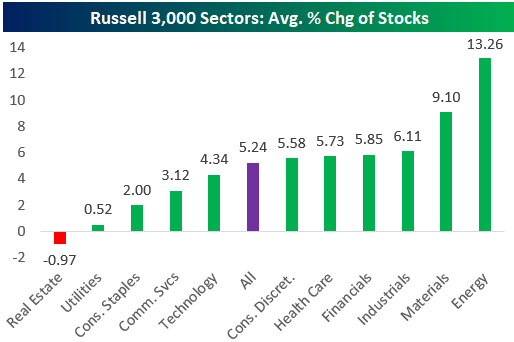
6. Russell 3000 YTD …Energy +13% vs. Tech +4%
Stocks Off to Strong Start to 2021
The average stock in the Russell 3,000 is already up 5.24% year-to-date after just four trading days. And to think, major indices were down ~1% on the first trading day of the year this past Monday. Below we highlight the average YTD performance of stocks by sector in the Russell 3,000. Remember, the Russell 3,000 contains large-caps, mid-caps, and small-caps, and it covers roughly 98.5% of all US-traded market cap. As shown, Energy stocks have jumped out to the strongest start to the year with an average gain of 13.26%. Materials rank second with a gain of 9.1%, and then Industrials, Financials, Health Care, and Consumer Discretionary are all bunched together with gains between 5% and 6%. Technology stocks — last year’s big leaders — are ‘only’ up 4.34% on average so far in 2021, while the Real Estate sector is the only one that has averaged declines.
https://www.bespokepremium.com/interactive/posts/think-big-blog/stocks-off-to-strong-start-to-2021
7. NERD E-Sports ETF +88% 1 Year
NERD ETF bottomed below $12 during Covid=19
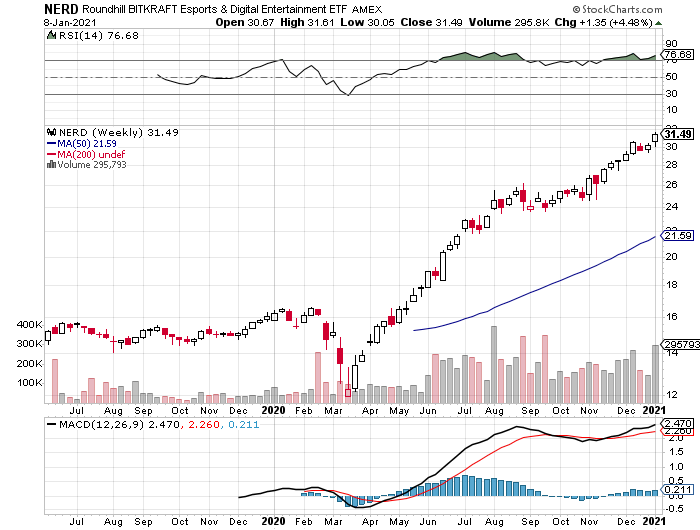
©1999-2021 StockCharts.com All Rights Reserved
TOP TEN HOLDINGS
as of 01/10/2021
View/Download Full ETF Holdings
| Weight | Name | Ticker |
| 5.26% | ACTIVISION BLIZZARD INC | ATVI |
| 5.21% | HUYA INC | HUYA |
| 5.15% | CORSAIR GAMING INC | CRSR |
| 5.14% | TENCENT HLDGS LTD | 700 HK |
| 4.95% | MODERN TIMES GROUP | MTGB SS |
| 4.86% | BILIBILI INC | BILI |
| 4.70% | DOUYU INTL HLDGS LTD | DOYU |
| 4.20% | NETEASE INC | NTES |
| 3.69% | AFREECATV CO LTD | 067160 KS |
| 3.67% | RAZER INC | 1337 HK |
ETF holdings and allocations are subject to change at any time and should not be interpreted as an offer of these securities.
https://www.roundhillinvestments.com/etf/nerd/
8. Low Volatility ETF Underperformed On Way Down and Back Up…Still Below Highs.
SPLV S&P 500 Low Volatility ETF still below highs
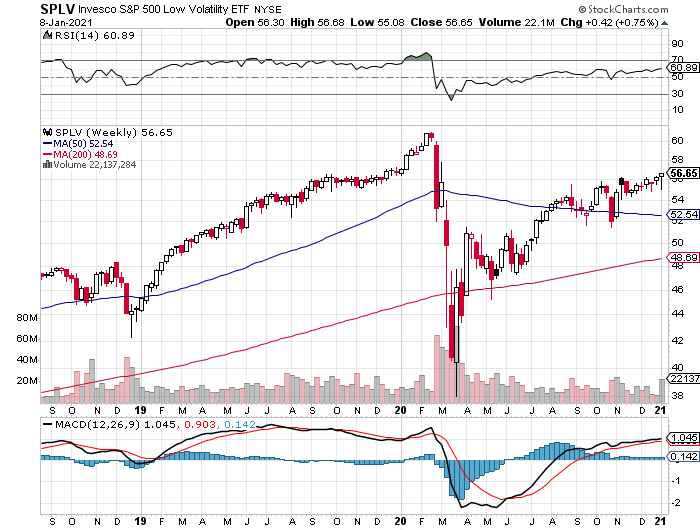
©1999-2021 StockCharts.com All Rights Reserved
9. Inflation Positive Stocks Vs. Deflation Positive Stocks
The Daily Shot Blog Equities: The news of Democrats taking control of the US Senate reignited the reflation trade. The market is betting on the federal government unleashing further fiscal stimulus, boosting consumption, economic growth, and inflation. Here is the relative performance of stocks that benefit from higher prices (Citi inflation long index) vs. those that do well in a deflationary environment.
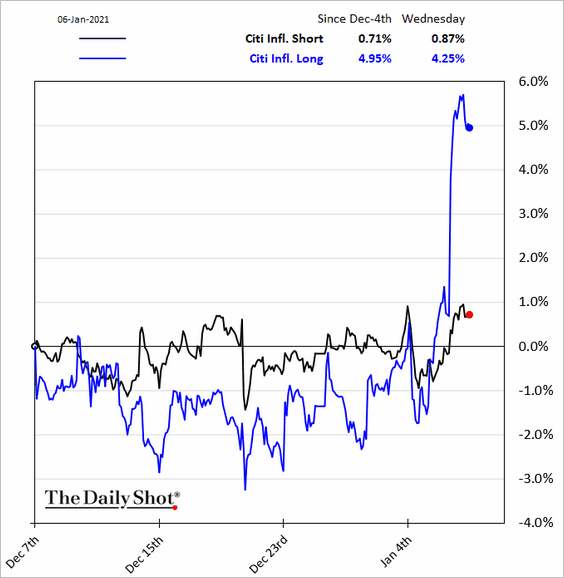
Source: The Daily Shot
Bank shares rose sharply. Notice the spread between the regional and total banking indices. Democrats are likely to tighten the regulatory environment, which may have a greater impact on larger banks.
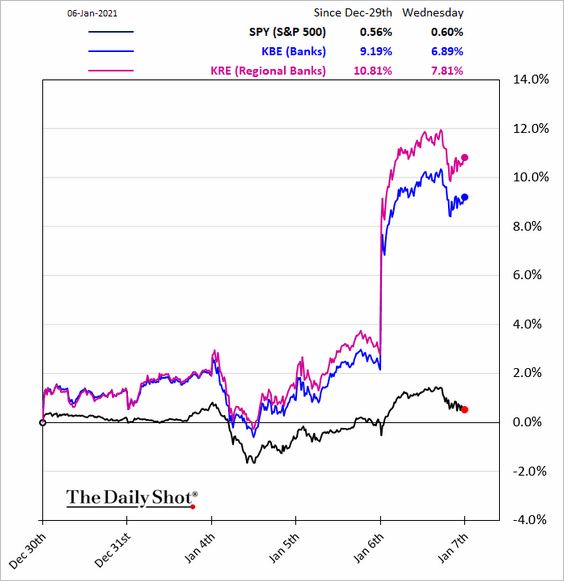
Source: The Daily Shot
https://dailyshotbrief.com/the-daily-shot-brief-january-7th-2021/
10. How to Optimize Your Daily Decisions
written by JAMES CLEAR
BEHAVIORAL PSYCHOLOGY DECISION MAKINGHABITS
You might assume that humans buy products because of what they are, but the truth is that we often buy things because of where they are. For example, items on store shelves that are at eye level tend to be purchased more than items on less visible shelves.
In the best-selling book Nudge (Kindle | Audiobook), authors Richard Thaler and Cass Sunstein explain a variety of ways that our everyday decisions are shaped by the world around us. The effect that eye-level shelves have on our purchase habits is just one example.
Here’s another:
The ends of aisles are money-making machines for retailers. According to data cited by the New York Times, 45 percent of Coca-Cola sales come specifically from end-of-the-aisle racks.
Here’s why this is important:
Something has to go on the shelf at eye level. Something has to be placed on the rack at the end of the aisle. Something must be the default choice. Something must be the option with the most visibility and prominence. This is true not just in stores, but in nearly every area of our lives. There are default choices in your office and in your car, in your kitchen and in your living room.
My argument is this:
If you design for default in your life, rather than accepting whatever is handed to you, then it will be easier to live a better life.
Let’s talk about how to do that right now.
Design for Default
Although most of us have the freedom to make a wide range of choices at any given moment, we often make decisions based on the environment we find ourselves in.
For example, if I wanted to do so, I could drink a beer as I write this article. However, I am currently sitting at my desk with a glass of water next to me. There are no beers in sight. Although I possess the capability to get up, walk to my car, drive to the store, and buy a beer, I probably won’t because I surrounded by easier alternatives—namely, drinking water. In this case, taking a sip of water is the default decision, the easy decision.
Consider how your default decisions are designed throughout your personal and professional life. For example:
- If you sleep with your phone next to your bed, then checking social media and email as soon as you wake up is likely to be the default decision.
- If you walk into your living room and your couches and chairs all face the television, then watching television is likely to be the default decision.
- If you keep alcohol in your kitchen, then drinking consistently is more likely to be the default decision.
Of course, defaults can be positive as well.
- If you keep a dumbbell next to your desk at work, then pumping out some quick curls is more likely to be the default decision.
- If you keep a water bottle with you throughout the day, then drinking water rather than soda is more likely to be the default decision.
- If you place floss in a visible location (like next to your toothbrush), then flossing is more likely to be the default decision.
Researchers have referred to the impact that environmental defaults can have on our decision making as choice architecture. It is important to realize that you can be the architect of your choices. You can design for default.
How to Optimize Your Default Decisions
Here are a few strategies I have found useful when trying to design for default in my life:
Simplicity. It is hard to focus on the signal when you’re constantly surrounded by noise. It is more difficult to eat healthy when your kitchen is filled with junk food. It is more difficult to focus on reading a blog post when you have 10 tabs open in your browser. It is more difficult to accomplish your most important task when you fall into the myth of multitasking. When in doubt, eliminate options.
Visual Cues. In the supermarket, placing items on shelves at eye level makes them more visual and more likely to be purchased. Outside of the supermarket, you can use visual cues like the Paper Clip Method or the Seinfeld Strategy to create an environment that visually nudges your actions in the right direction.
Opt-Out vs. Opt-In. There is a famous organ donation study that revealed how multiple European countries skyrocketed their organ donation rates: they required citizens to opt-out of donating rather than opt-in to donating. You can do something similar in your life by opting your future self into better habits ahead of time. For example, you could schedule your yoga session for next week while you are feeling motivated today. When your workout rolls around, you have to justify opting-out rather than motivating yourself to opt-in.
Designing for default comes down to a very simple premise: shift your environment so that the good behaviors are easier and the bad behaviors are harder.
Designed For You vs. Designed By You
Default choices are not inherently bad, but the entire world was not designed with your goals in mind. In fact, many companies have goals that directly compete with yours (a food company may want you to buy their bag of chips, while you want to lose weight). For this reason, you should be wary of accepting every default as if it is supposed to be the optimal choice.
I have found more success by living a life that I design rather than accepting the standard one that has been handed to me. Question everything. You need to alter, tweak, and shift your environment until it matches what you want out of life.
Yes, the world around you shapes your habits and choices, but there is something important to realize: someone had to shape that world in the first place. Now, that someone can be you.
If you want more practical ideas for breaking bad habits and creating good habits, check out my book Atomic Habits, which will show you how small changes in habits can lead to remarkable results.
Disclosure
Lansing Street Advisors is a registered investment adviser with the State of Pennsylvania..
To the extent that content includes references to securities, those references do not constitute an offer or solicitation to buy, sell or hold such security as information is provided for educational purposes only. Articles should not be considered investment advice and the information contain within should not be relied upon in assessing whether or not to invest in any securities or asset classes mentioned. Articles have been prepared without regard to the individual financial circumstances and objectives of persons who receive it. Securities discussed may not be suitable for all investors. Please keep in mind that a company’s past financial performance, including the performance of its share price, does not guarantee future results.
Material compiled by Lansing Street Advisors is based on publicly available data at the time of compilation. Lansing Street Advisors makes no warranties or representation of any kind relating to the accuracy, completeness or timeliness of the data and shall not have liability for any damages of any kind relating to the use such data.
Material for market review represents an assessment of the market environment at a specific point in time and is not intended to be a forecast of future events, or a guarantee of future results.
Indices that may be included herein are unmanaged indices and one cannot directly invest in an index. Index returns do not reflect the impact of any management fees, transaction costs or expenses. The index information included herein is for illustrative purposes only.