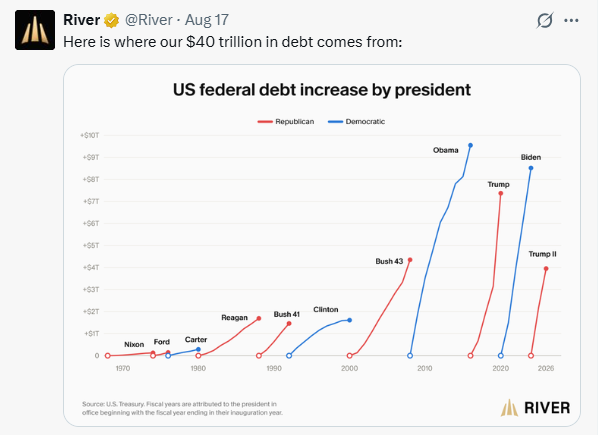
1. History of $40Trillion U.S. Government Debt
River
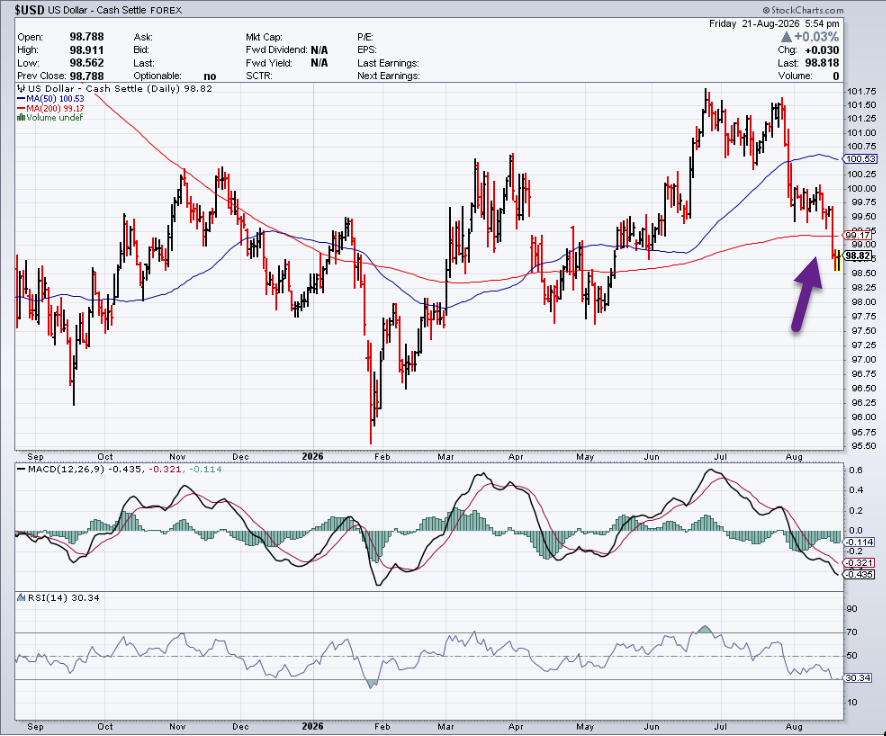
2. U.S. Dollar Resumes Downtrend -2.5% …Closes Below 200day
StockCharts
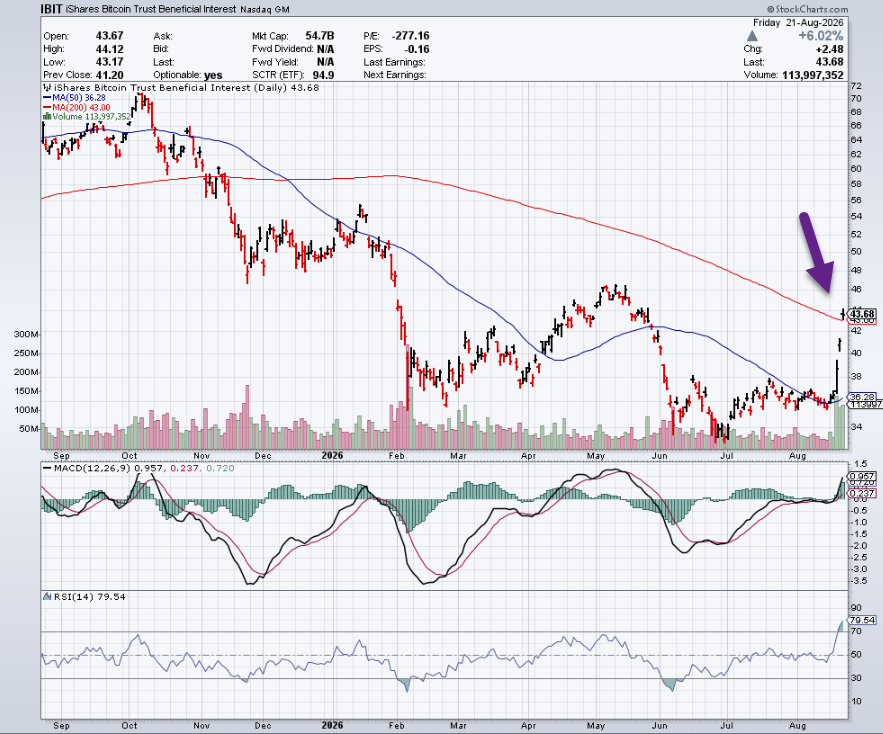
3. Bitcoin ETF IBIT +27% in 5 Trading Days….Closes Above 200-Day
StockCharts
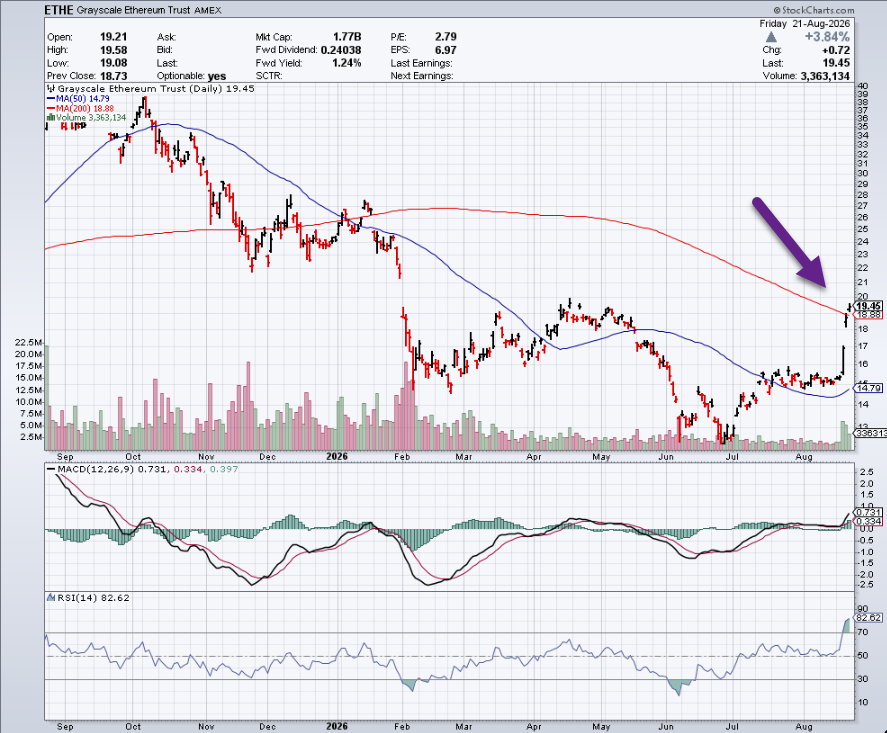
4. Ethereum +27% in 5 Trading Days… Closes Above 200 Day
StockCharts
5. Mid-Term Election Year Seasonality
Here’s the seasonal wrinkle though. In midterm years going back to 1990, the S&P 500 equal weight has historically peaked around August 18th. That’s followed by a roughly 8% average pullback into October.
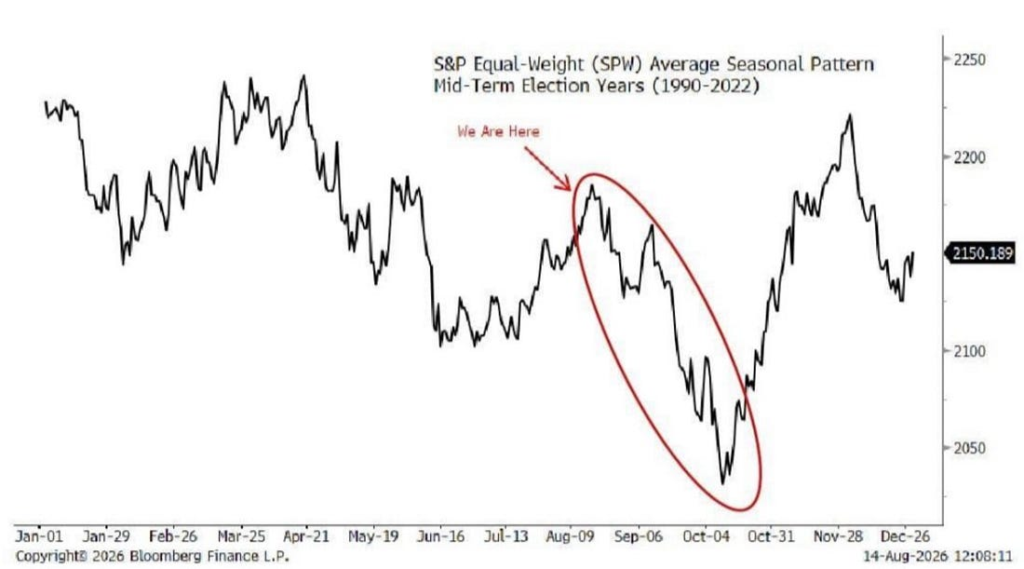
Source: David Marlin
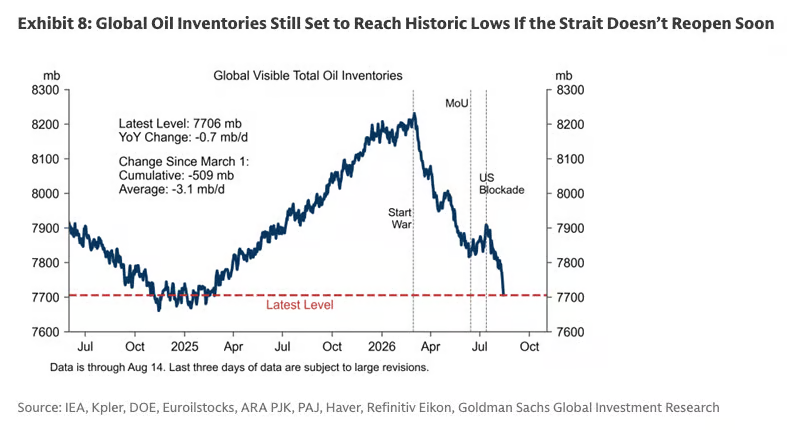
6. Global Oil Inventories Update
Global oil inventories. “With global oil demand recovering, inventories are again falling quickly and will reach all-time lows (in a series available back to 2018) if the Strait of Hormuz doesn’t reopen soon.”
7. How Do Americans Fall for Financial Scams? Well….30% of Americans Believe in Magic
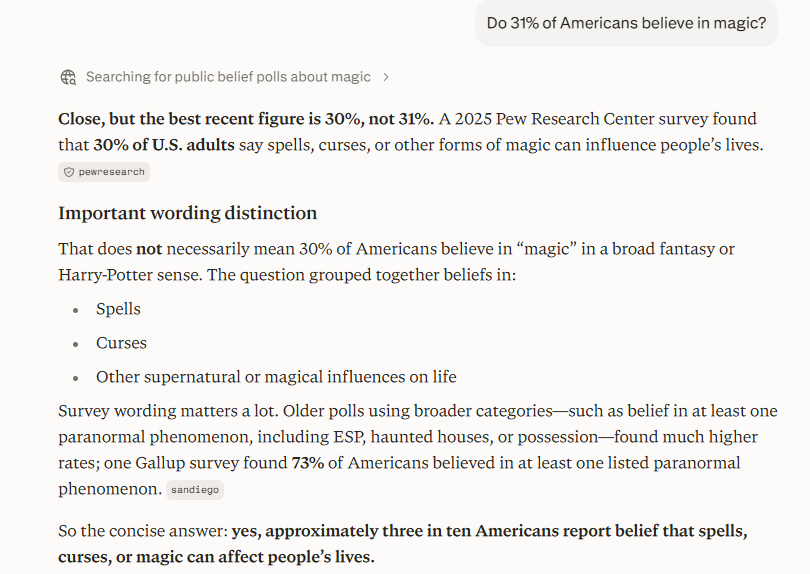
StockCharts
8. Countries Where Fortune Telling is Common
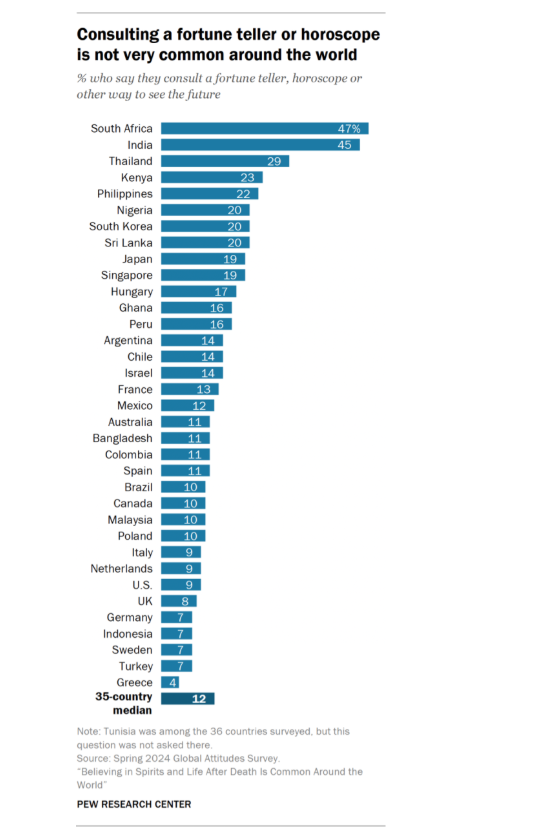
Pew Research Center
9. Open AI=230 Million People Ask Health Related Questions Per Week
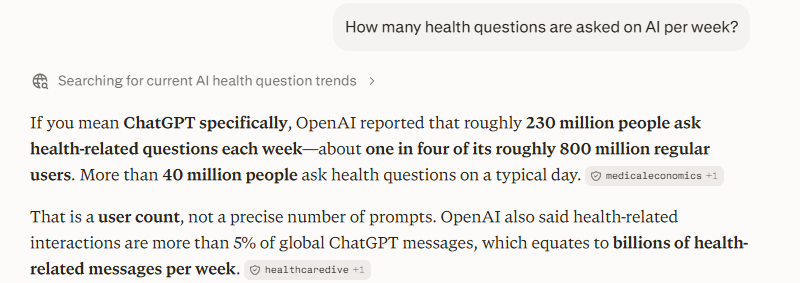
Perplexity
10. 25 Sentences to Live By