1.What Happens Post One Day Volatility Spike?
Volatility Returns
The Volatility Index ($VIX) spiked 54% on Friday, its 4th largest 1-day increase in history (note: $VIX data goes back to 1990).
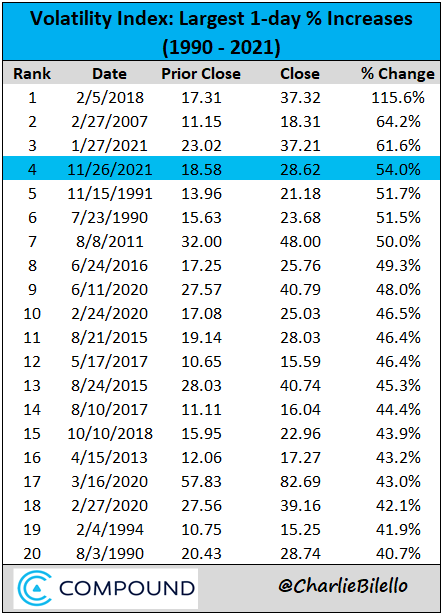
Here’s a look at how the S&P 500 has performed following prior volatility spikes…

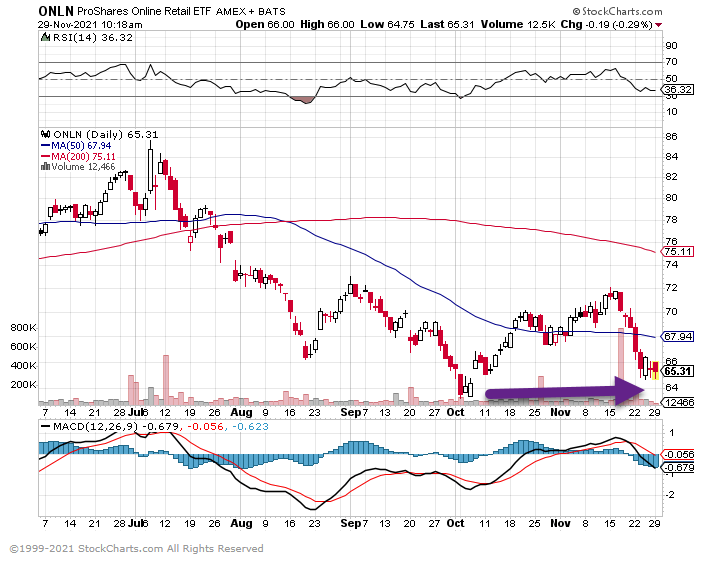
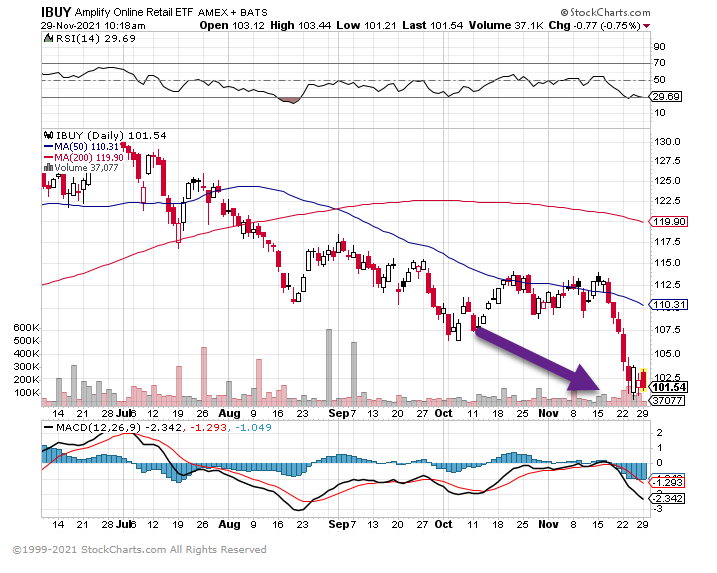
2.Online Shopping ETFs Down Big From Highs.
ONLN -31% from highs
IBUY -27% from highs
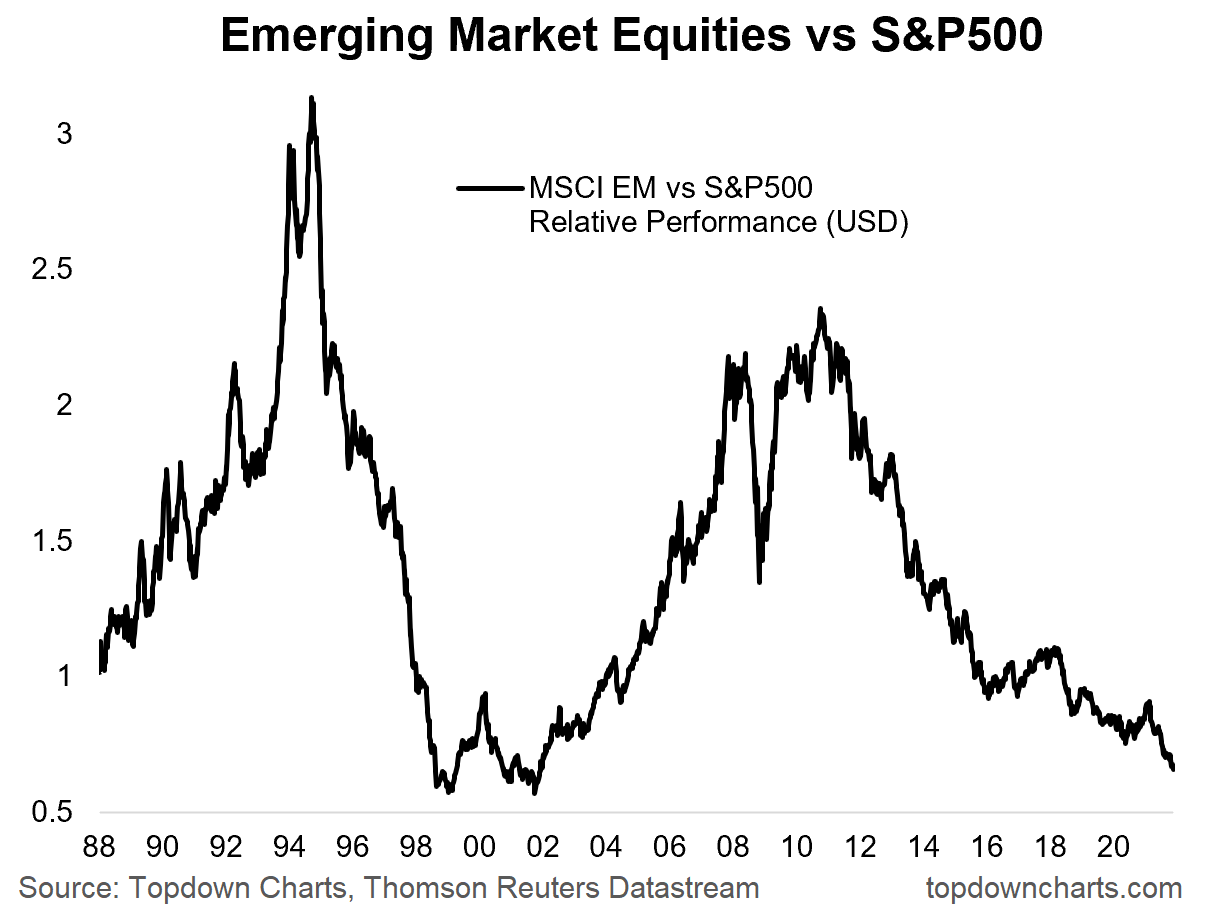
3.Emerging Markets Relative Performance About to Officially Hit 1999-2000 Levels.
Top Down Charts
https://www.linkedin.com/pulse/weekly-sp500-chartstorm-28-november-2021-callum-thomas/?trk=eml-email_series_follow_newsletter_01-hero-1-title_link&midToken=AQFjhnSMpoKQvw&fromEmail=fromEmail&ut=2-w9kcp7sRDq01
4.International Stocks Correlation to U.S. Stocks Jumps During Bear Markets.
This is illustrated in the accompanying chart, which plots the correlation of monthly returns over the trailing five years of the S&P 500 and the EAFE ETF. Notice that the correlations jump during bear markets.

Opinion: Is investing in foreign stocks a good idea By Mark Hulbert
5.Healthcare Sector at All-Time Discount to S&P
From Top Down Charts

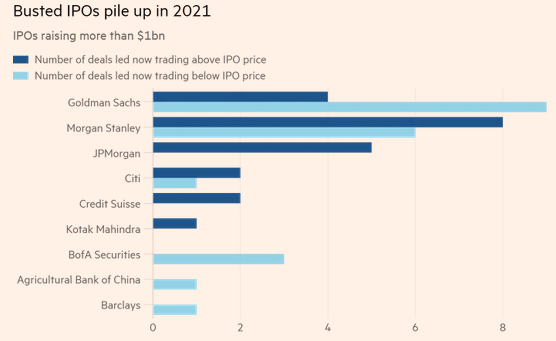
6.Half of 2021 IPOs Trading Below Listing Price.
From Dave Lutz at Jones Trading-Half of this year’s big IPOs are trading below listing price – Dealogic data show 49 per cent of the 43 IPOs that raised $US1 billion or more this year in London, Hong Kong, India and New York are trading below their issuance prices, FT reports. By comparison, among large IPOs that listed in 2019, about 33 per cent were below issuance price a year after hitting the market, while 27 per cent of those priced in 2020 were in the red after 12 months of trading.
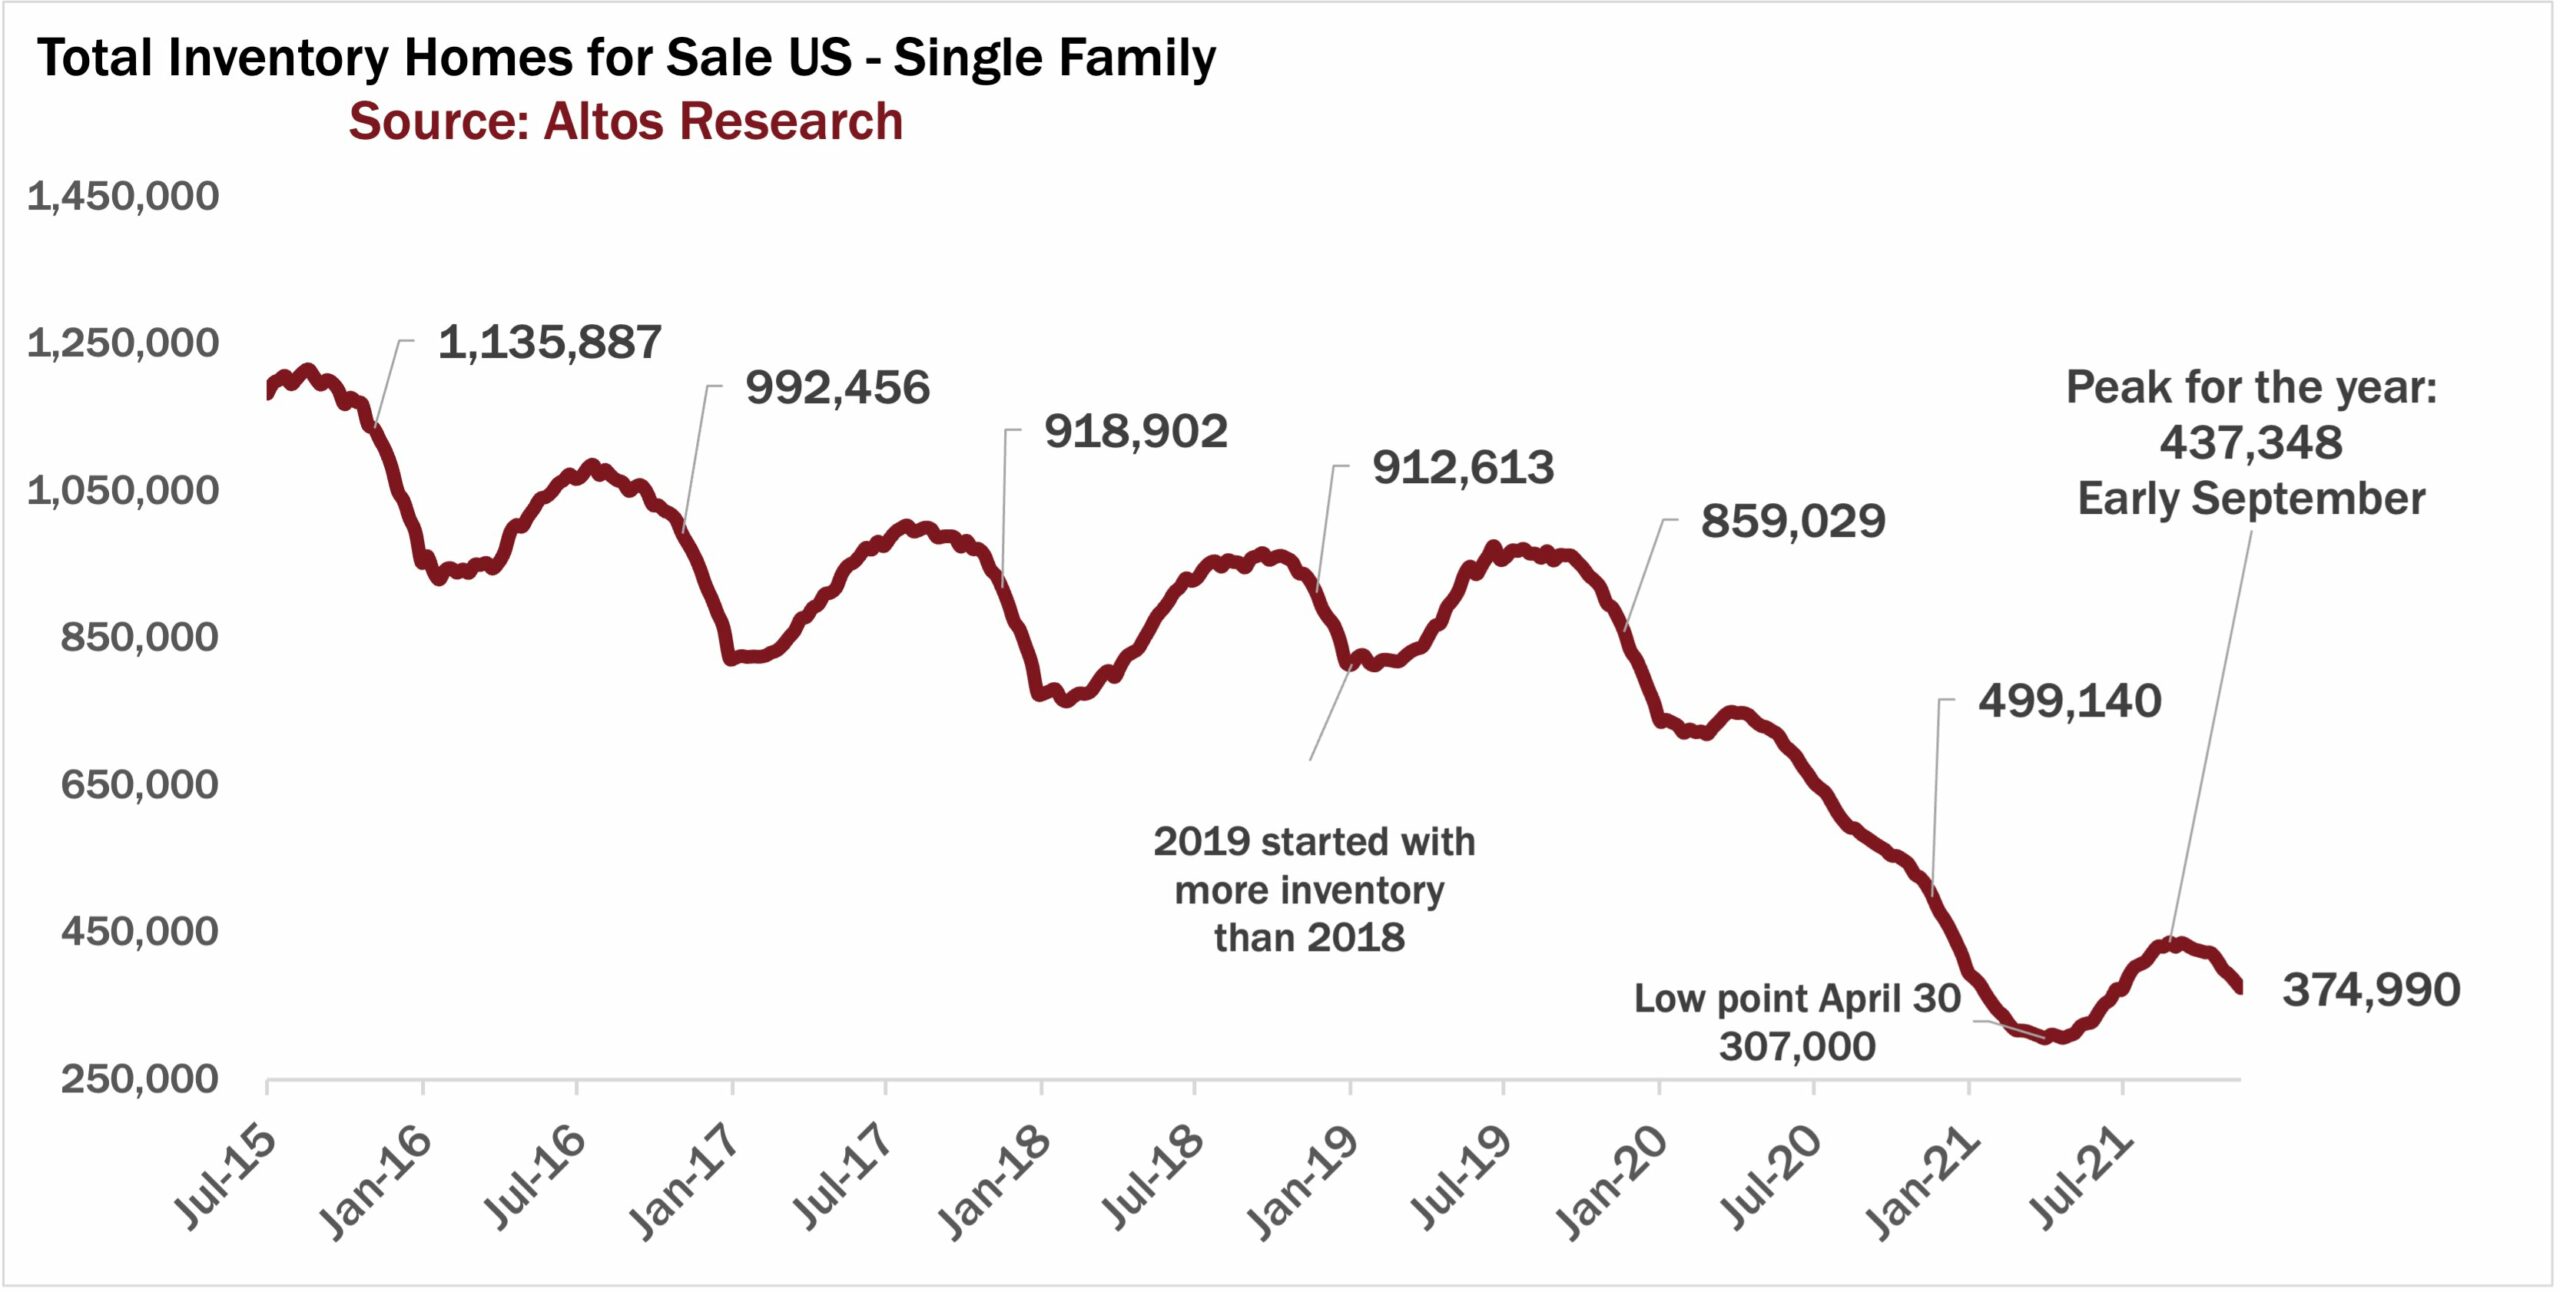
7.Constructions Costs +13.3% Year Over Year.
Construction costs spiked out the wazoo.
The index for construction costs of singled-family houses spiked 13.3% year-over-year in October, the worst year-over-year increase since 1979, and by 18.5% in the two years since October 2019, according to data by the Commerce Department. Construction costs have jumped year-over-year by the double-digits every month since May. This excludes the cost of land and other non-construction costs:

In terms of the index in the chart below, not the year-over-year percentage change, you can see the spike in construction costs taking off in June 2020 (black dot), and has been relentless ever since.
During the housing bust, construction costs fell 11.5% from the peak in April 2007 through May 2010, and then didn’t really move much for another two years. The opposite is happening now:

Construction Costs Spike Most in 42 Years–By Wolf Richter for WOLF STREET.
8.Current Conditions Update for Homes ….84% of Top
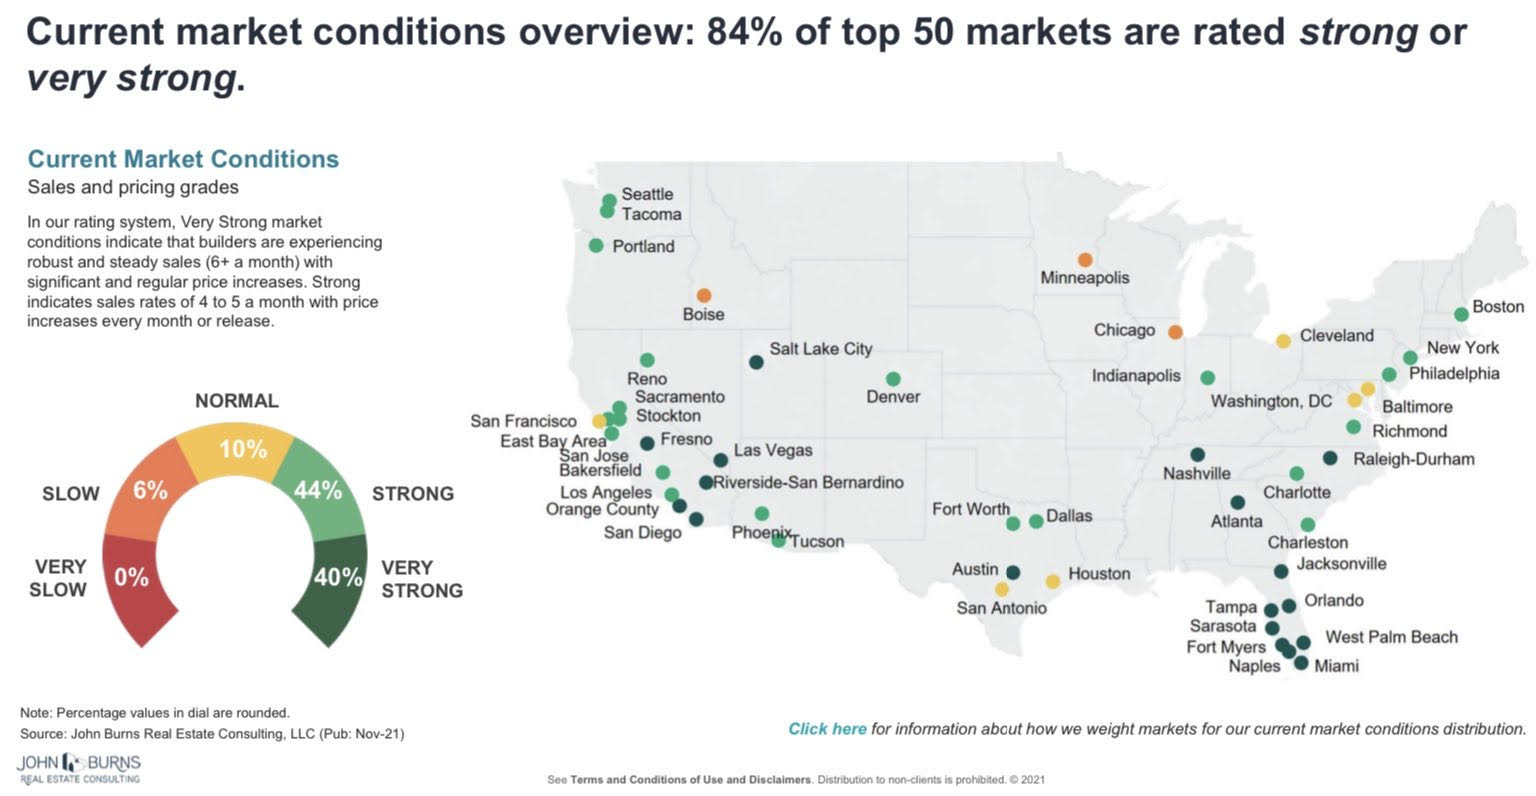
https://www.realestateconsulting.com/
@mikesimonsen https://twitter.com/
9.Inflation has risen in many countries, but rarely as much as in U.S.
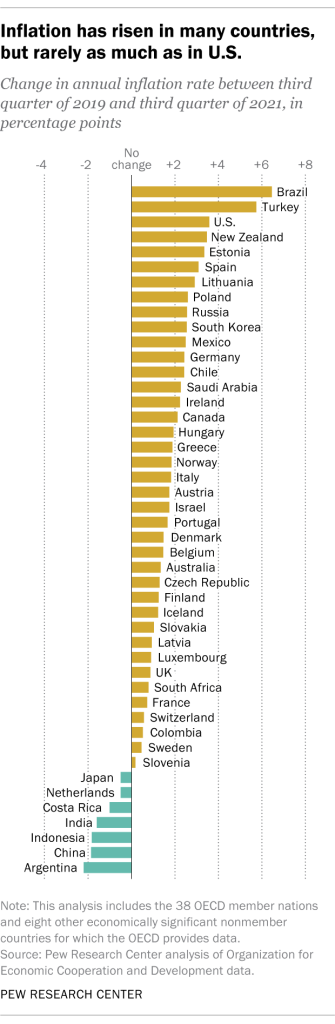
https://www.pewreserch.prg/fact-tank/2021/11/24/inflation-has-risen-around-the-world-but-the-u-s-has-seen-one-of-the-biggest-increases/ft_21-11-17_inflationaroundtheworld_bar_new/
10.The Six Mindsets for Better Problem-Solving.
