
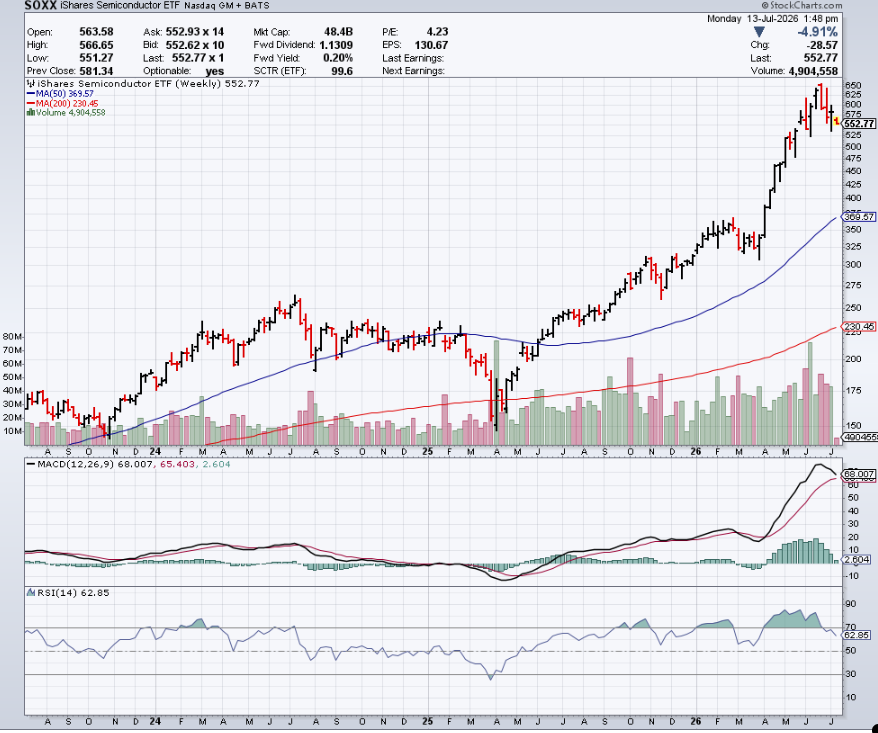
1. Semiconductor Index Moved Up or Down 3% 15 Times in Last 30 Days
StockCharts
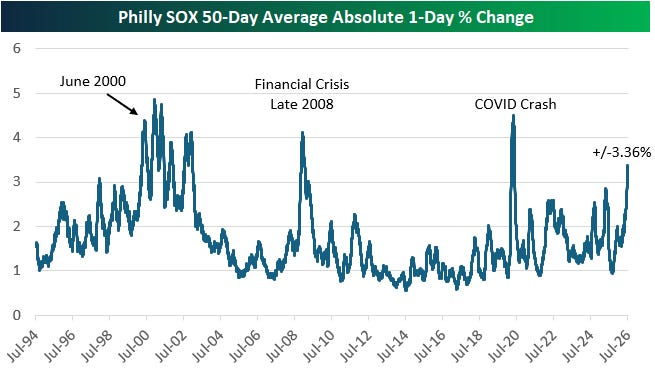
2. History of Semiconductor (SOX) Volatility
Loved by Analysts, Hated by Investors
The market got off to a bad start this week with the major indices in the red as oil and interest rates spiked sharply on renewed tensions with Iran. The semis fell nearly 5% as the SOX saw its ninth straight Monday with a gain or loss of at least 1%. The SOX has seen an average daily move of +/-3.36% over the last 50 trading days. As shown below, the only other times we’ve seen this much daily vol were in the lead-up to the Dot Com peak and then down the other side of the mountain, the Financial Crisis in late 2008, and in early 2020 during the COVID Crash.
Bespoke
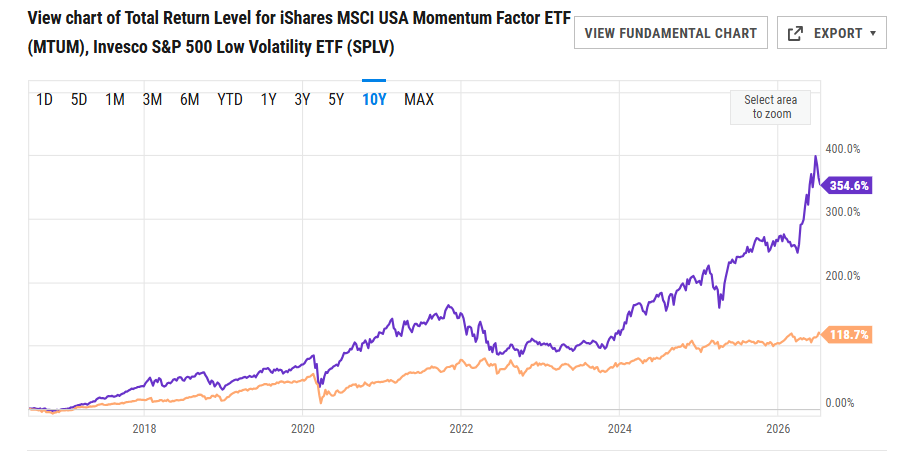
3. Momentum (MTUM) Outperformance of Low Volatility Stocks (SPLV) is at Record Levels….10-Year Chart =the Big Outperformance is 2024-Now
YCharts
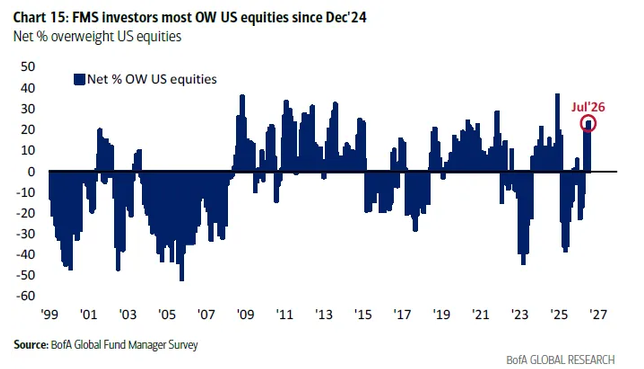
4. FLOWS-Active Managers Extremely Bullish
Dave Lutz Jones Trading Global investors buying stocks aggressively should consider reducing exposure, according to Bank of America Corp.’s fund manager survey. Asset allocators have become extremely bullish, a typical warning sign for markets, with cash levels falling to an “uber-low” level of 3.6% of assets from 4.1% last month, strategists from the bank said. Positioning on US equities is now at its highest level since December 2024 at a net 24% overweight, the survey showed.
5. FLOWS-Individual Retail Investors Single Stock Buying Plummets
Retail activity. “Retail investors’ net single-stock buying has fallen to a new post-COVID low”.
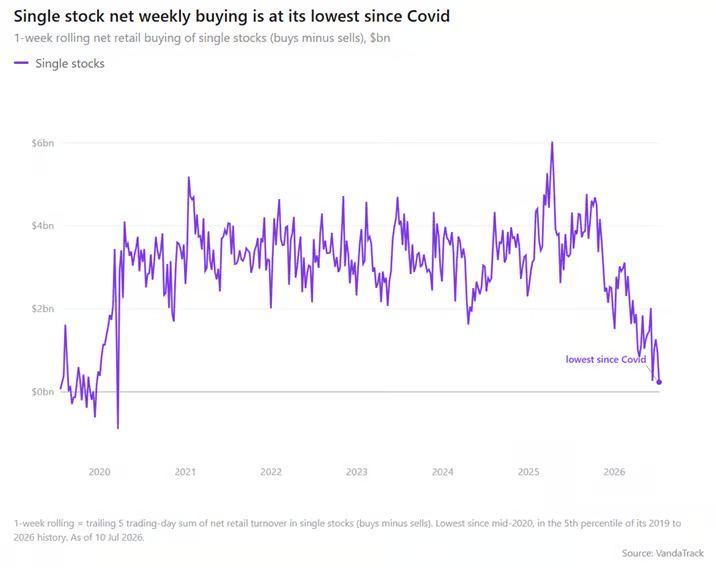
Vanda Research via @kevrgordon
6. FLOWS-ETFs Dominate…State Street Projects $2.3 Trillion in Flows to ETFs 2026
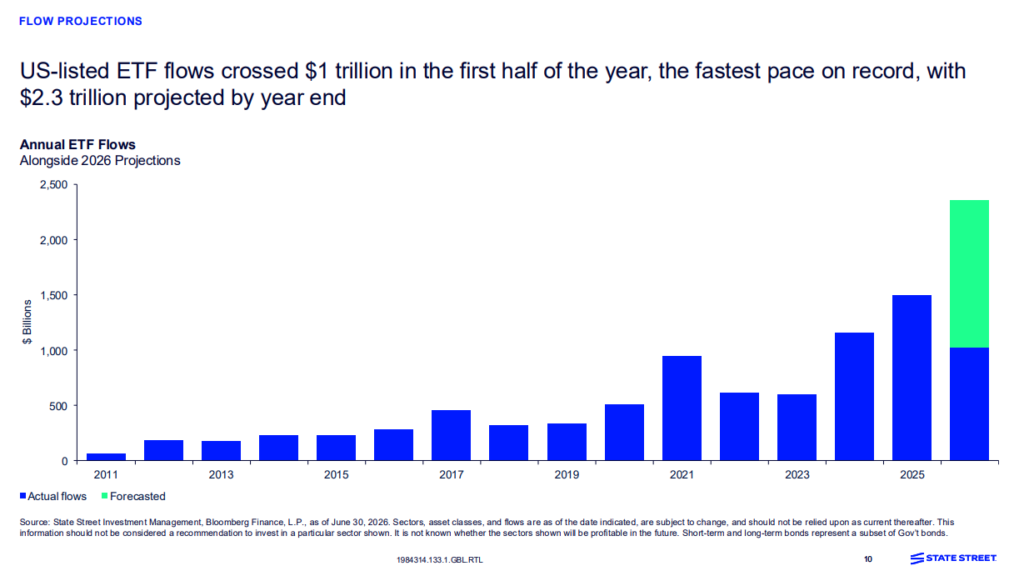
State Street Investment Management Chart Pack
7. DRAM ETF -30% from High of $80…-20% One Month
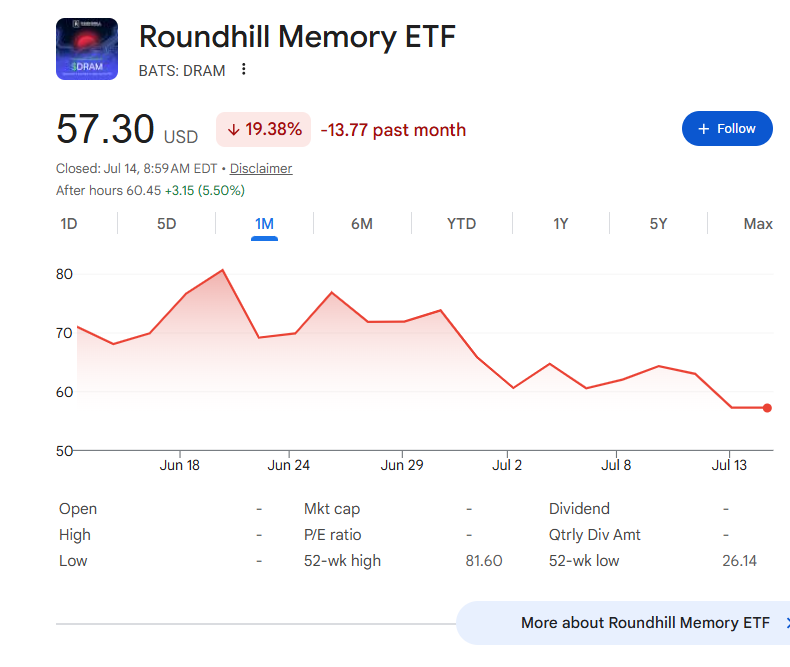
Google Finance
8. Russian and Chinese Bots Now Turning Americans Against Each Other on Data Centers
NYT-China, Russia and Others Seek to Inflame Debate Over A.I. Data Centers State actors in China, Russia and Iran have sought to exploit the U.S. public debate over the effects of the technology.
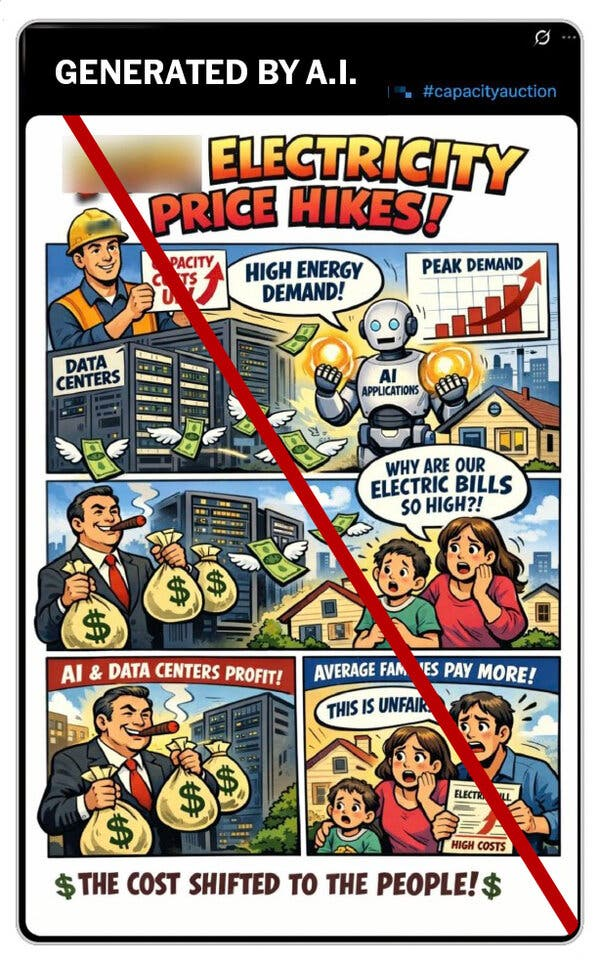
NY Times
OpenAI released this cartoon as an example of one generated with ChatGPT by people in China who the company believed were affiliated with a regional government. It is not clear what word in the title was blurred out.By Steven Lee Myers and Dustin Volz
A state-owned newspaper in China recently published a satellite image of a data center in Gainesville, Va., writing in English that the development of artificial intelligence posed a threat to Americans’ physical and financial well-being.
A comic strip made to look as if it had been published by a Maryland news outlet — created with OpenAI’s ChatGPT by people in China, the tech company said — circulated on X this year, blaming data centers for soaring electricity bills. It showed a tycoon smoking a cigar and clutching bags of cash.
A video shared on X by a known covert Russian influence operation questioned the viability of a data center that an American company, Firebird, is constructing in Armenia, the small Caucasus nation that has been a focus of Kremlin pressure. “The country’s electrical grid instability may render it useless,” the video’s narrator says.
All are examples of a push by foreign adversaries to seize on what polls have shown is deep ambivalence — verging at times on hostility — about the spread of the data centers needed to power A.I. in the United States and elsewhere.
9. 2.6% of Americans Live in Subsidized Housing
The state of Section 8
The federal government has provided rental assistance to low-income Americans since the 1937 US Housing Act, and the Department of Housing and Urban Development (HUD) now oversees eight different nationwide housing assistance programs. The latest data shows how many units the country has, who lives in them, and how long they must wait for one.
- About 8.86 million people, or 2.6% of the US population, lived in subsidized housing in 2025. On average, residents had lived in their units for 10 years and three months.

USAFacts
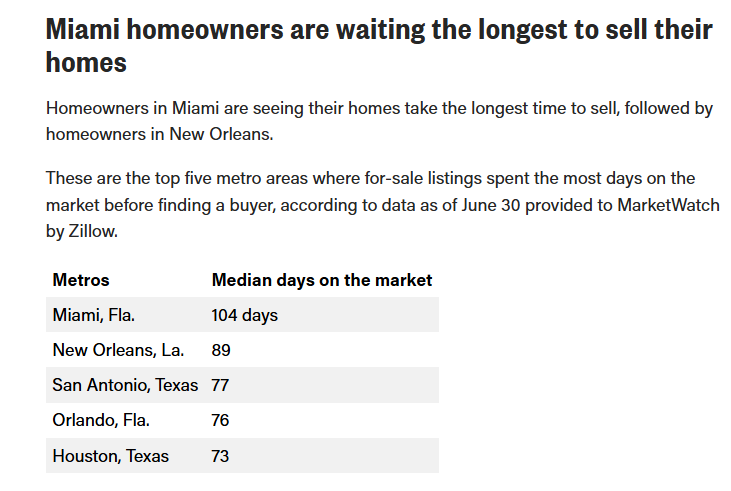
10. Cities with Longest Time to Sell a Home
Market Watch