Nearly every public benchmark has moved upward since last year, making previous standards of excellence look decidedly ordinary
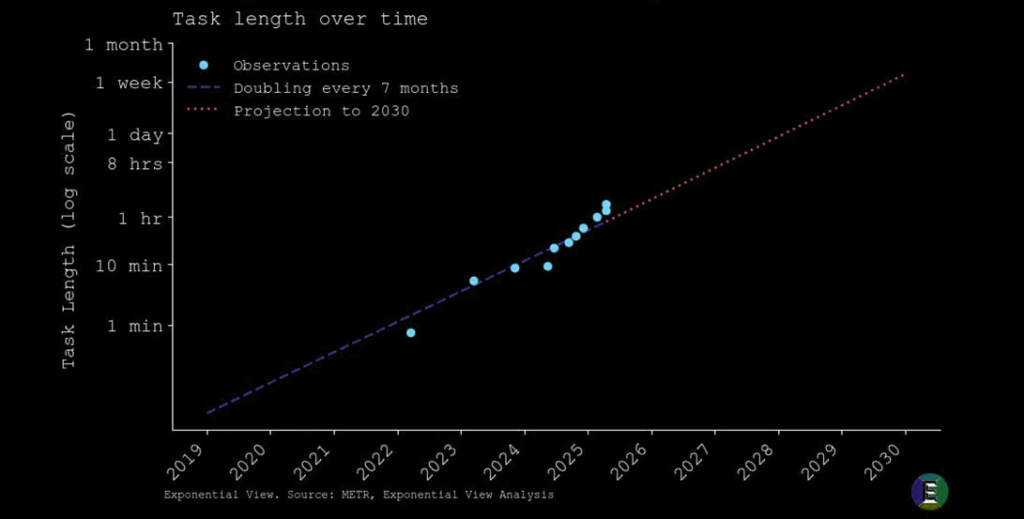
The length of tasks AI can do is increasing.
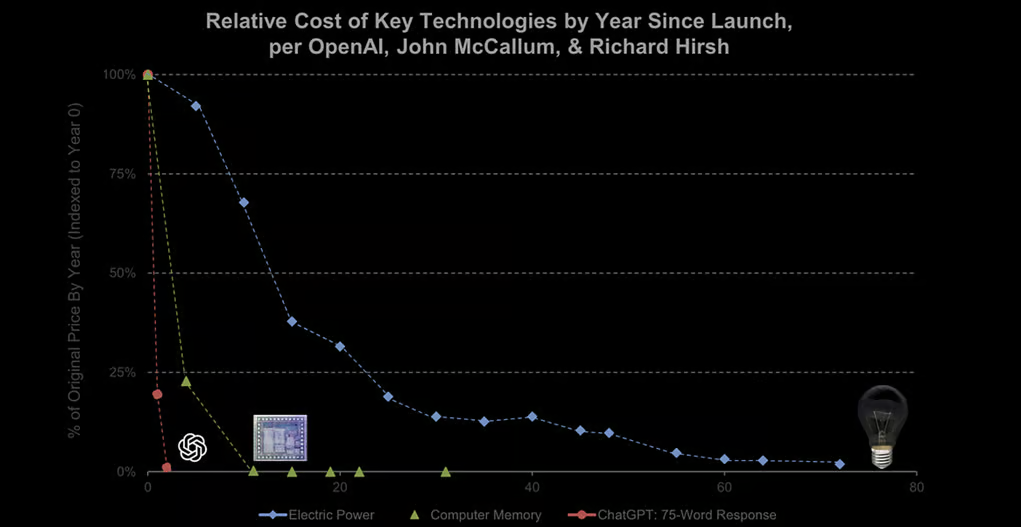
Perhaps even more crucially, the unit costs of AI are plunging exponentially. Azeem Azhar: “This is central to my definition of exponential technology—not solely about improving performance but about rapidly collapsing costs for a given capability.”
Zach Goldberg Jefferies
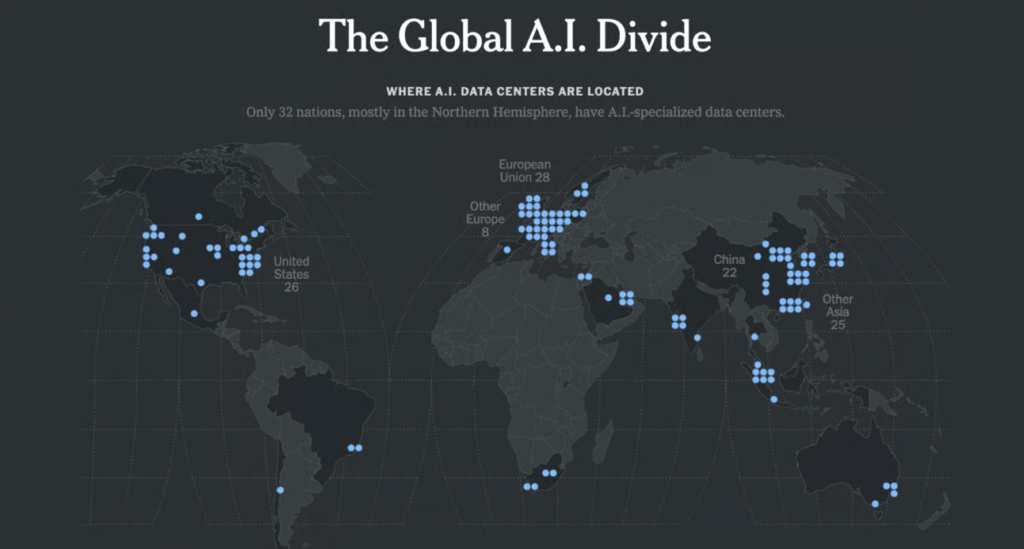
2. 195 Countries in World Today….32 Have an AI Data Center
NYT
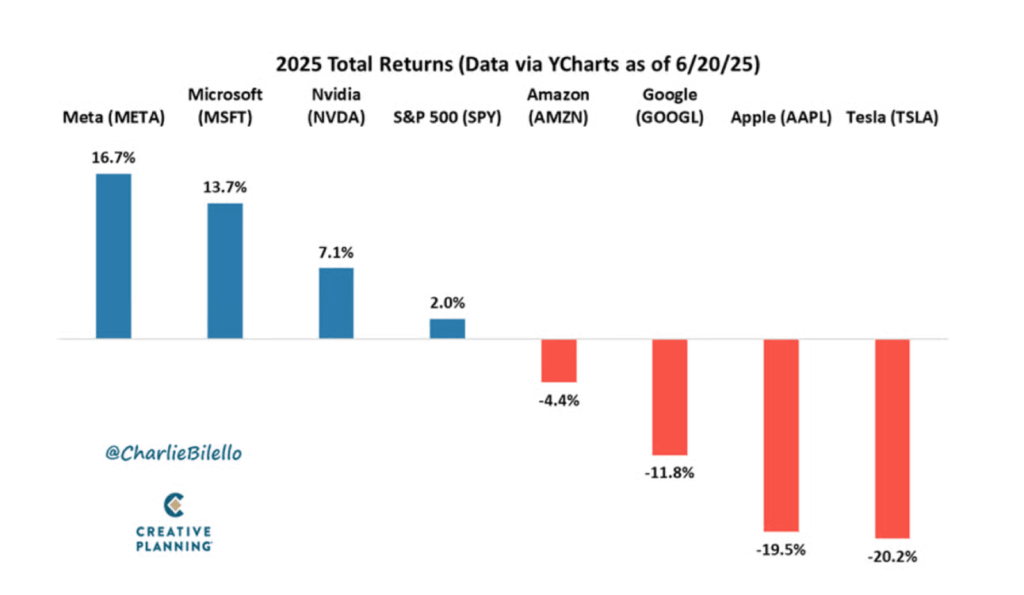
3. MAG 7 Returns 2025
Charlie Bilello
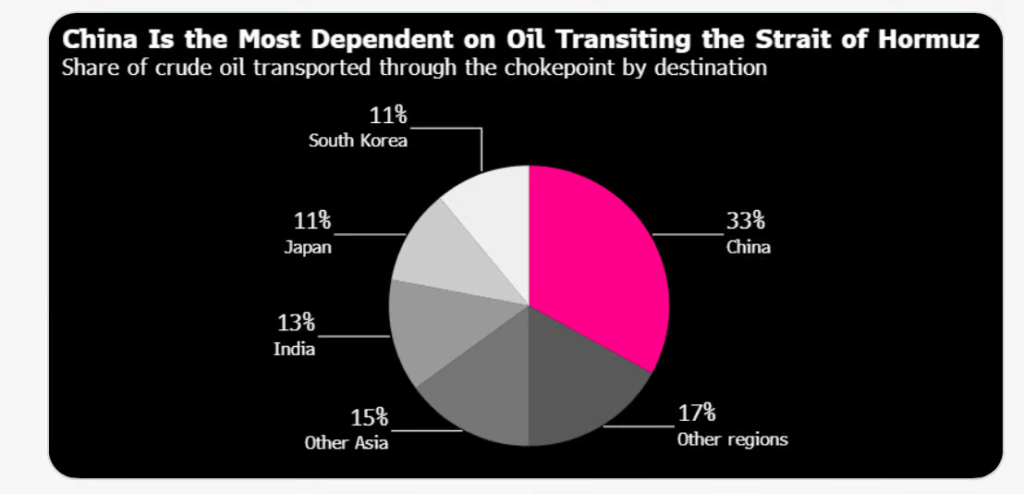
4. Strait of Hormuz Oil Destinations
Social Site News
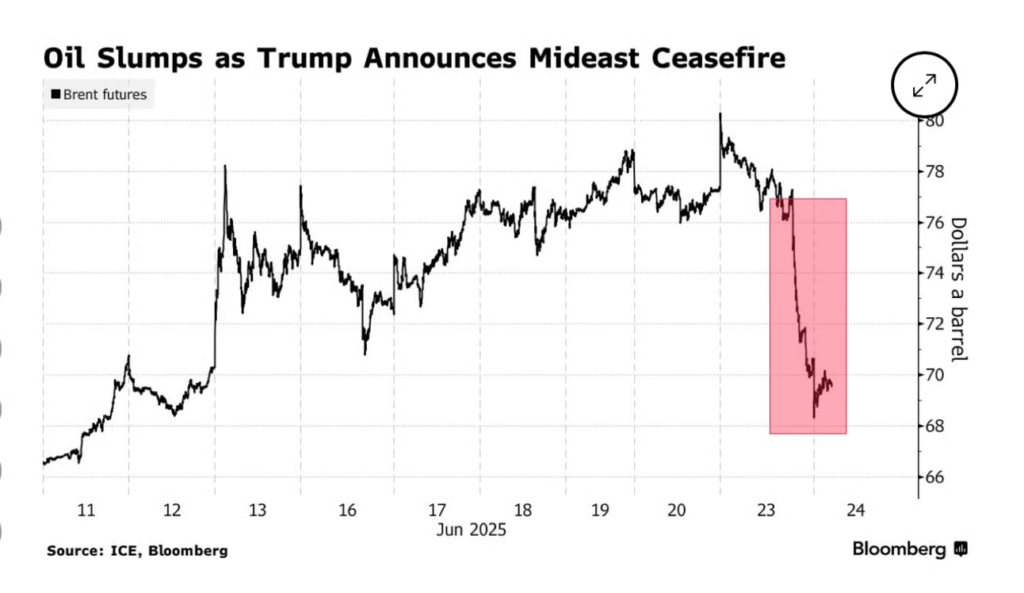
5. Israel and U.S. Bomb Iran—Oil Collapses
Daily Chartbook
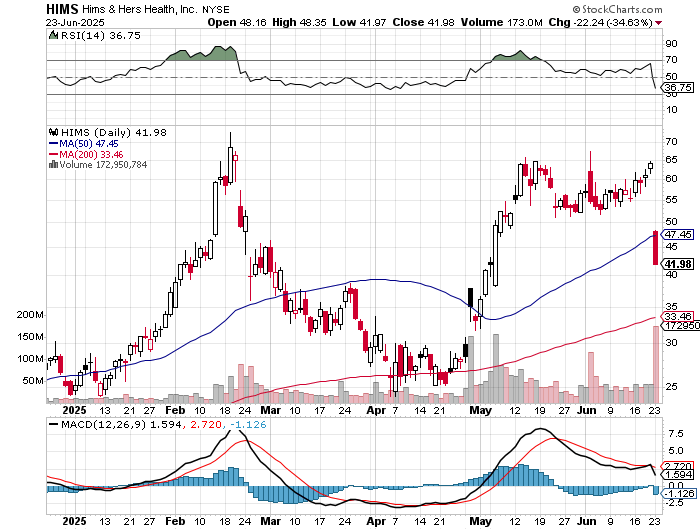
6. HIMS -35% in One Day…Still Not Back to May Lows….Still +66% Year to Date
StockCharts
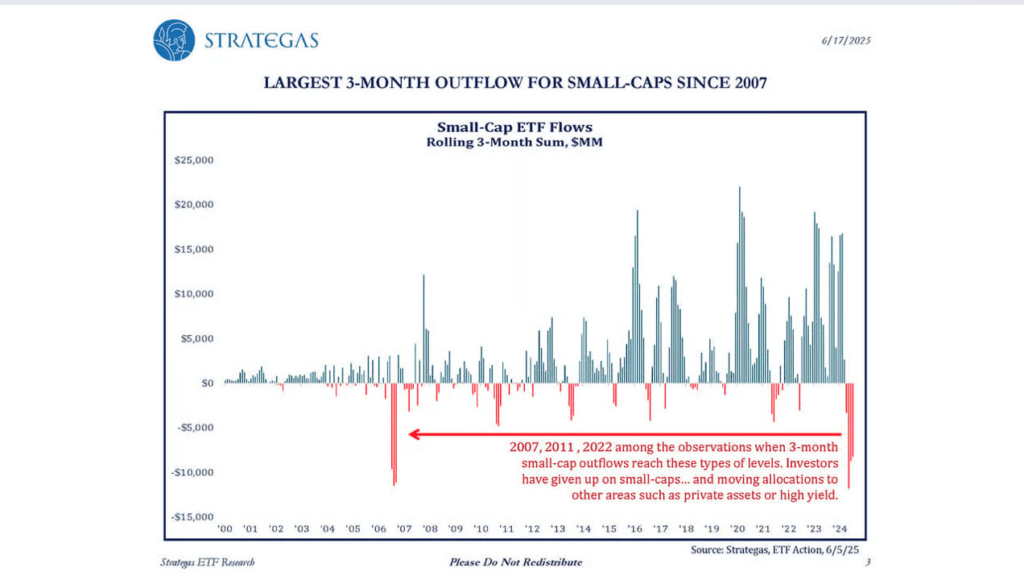
7. Largest 3-Month Outflows from Small Cap Stocks Since 2007
The Irrelevant Investor
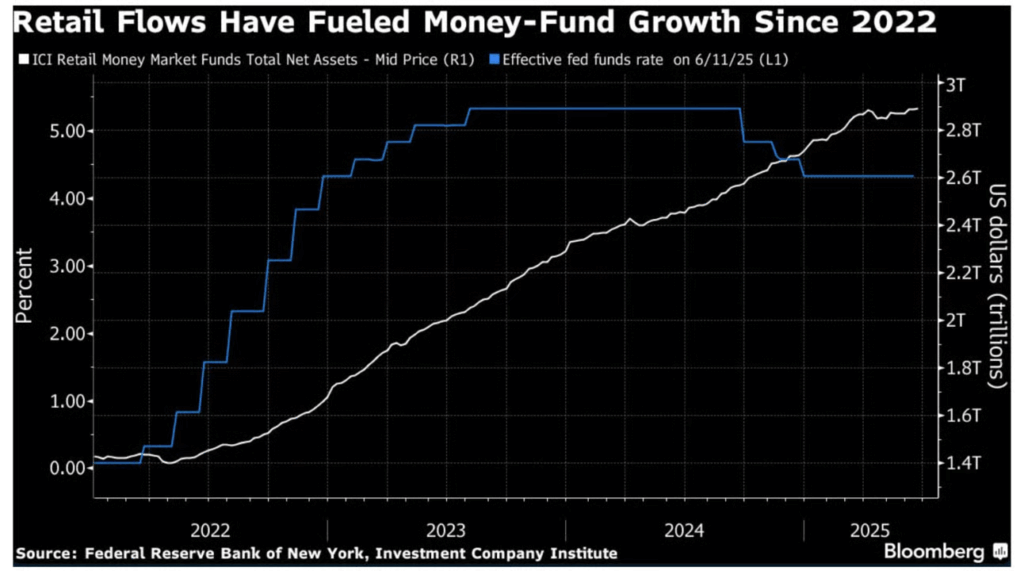
8. $320B Flows into Money Market Funds 2025
Bloomberg-Households have been a key driver of the inflows. Since the Fed started raising rates in March 2022, total assets under management in US money funds have swelled by roughly $2.5 trillion, and retail investors have accounted for about 60% of that, Investment Company Institute data show. Data from ICI exclude firms’ own internal money funds, unlike Crane Data, which tracks the money market industry.
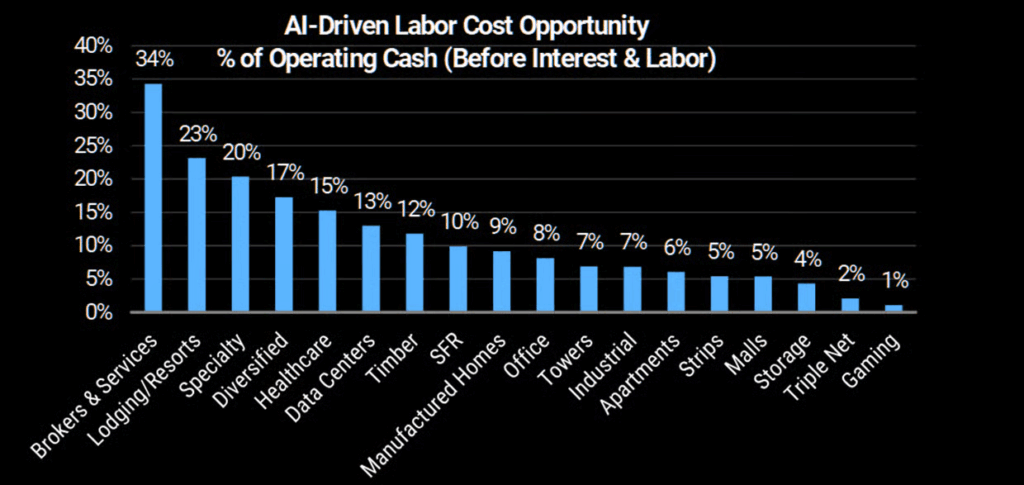
2. Automation Deflationary and Upside Operating Cash Flow
The Upside of Automation…MS shows, the potential operating cash flow upside from GenAI automation.
Zachary Goldberg Jefferies
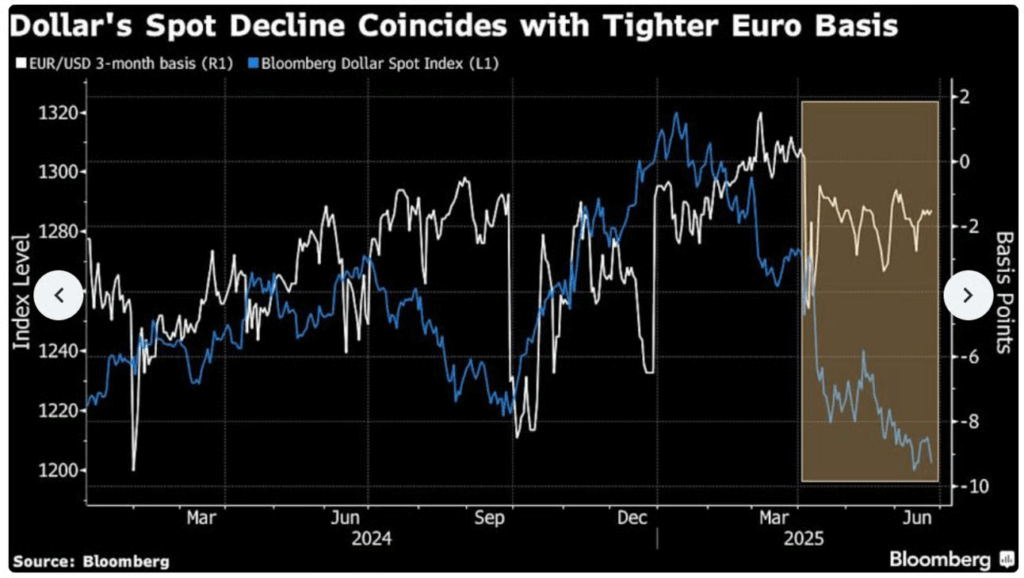
3. Dollars Decline Information
Yahoo!Finance
Analysts at a handful of banks including Morgan Stanley and Goldman Sachs Group Inc. all point to recent shifts in so-called cross-currency basis swaps — a gauge of how much it costs to exchange one currency for another beyond what would normally be implied by borrowing costs in the cash markets. As demand for a particular currency increases, that extra cost or premium rises, and likewise declines or even can go negative when appetite isn’t as strong.
These analysts note that when markets melted down in April following US President Donald Trump’s “Liberation Day” tariff announcement, the preference for dollars as measured by basis swaps was relatively minor and short-lived. Meanwhile, demand for other currencies such as the euro and yen has grown. That stands in sharp contrast to previous scrambles for safety over the last two decades, such as the onset of the pandemic, which saw the dollar command a premium in global funding markets for a sustained period.
Over time, this waning preference for dollar liquidity, particularly relative to the euro, could ultimately make it more expensive to borrow Europe’s common currency relative to the greenback — presenting a challenge for the US currency at a time when its preeminent position in world finance is facing growing doubts.
“Recent cross-currency basis movements suggest investors have less appetite to buy dollar-denominated assets and more appetite to buy those denominated in euro and yen,” the Morgan Stanley team including Koichi Sugisak and Francesco Grechi wrote in a June report. In fact, the US tariff impact appeared to be “triggering a temporary withdrawal from dollar assets,” the Morgan Stanley analysts wrote.
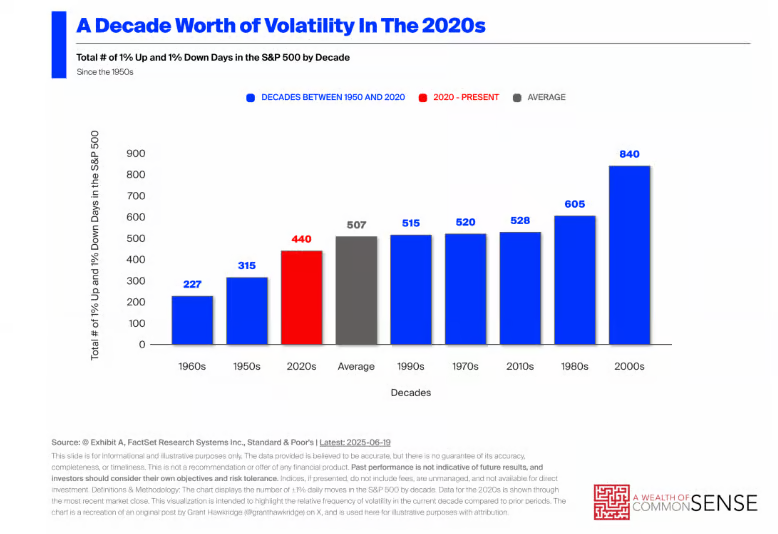
4. A Decade Worth of Volatility in 5 Years
A Wealth of Common Sense
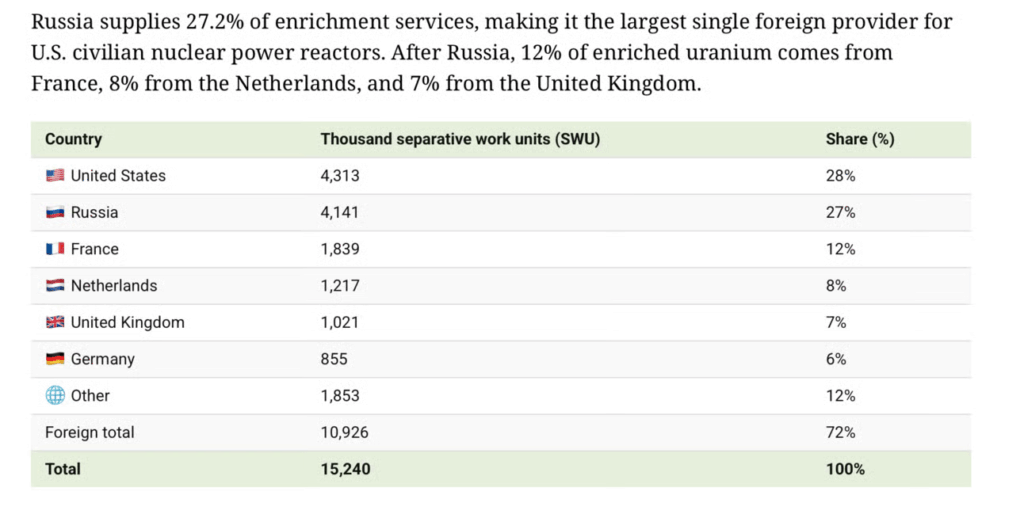
5. Where Does America Get Its Uranium? 27% from Russia
Visual Capitalist
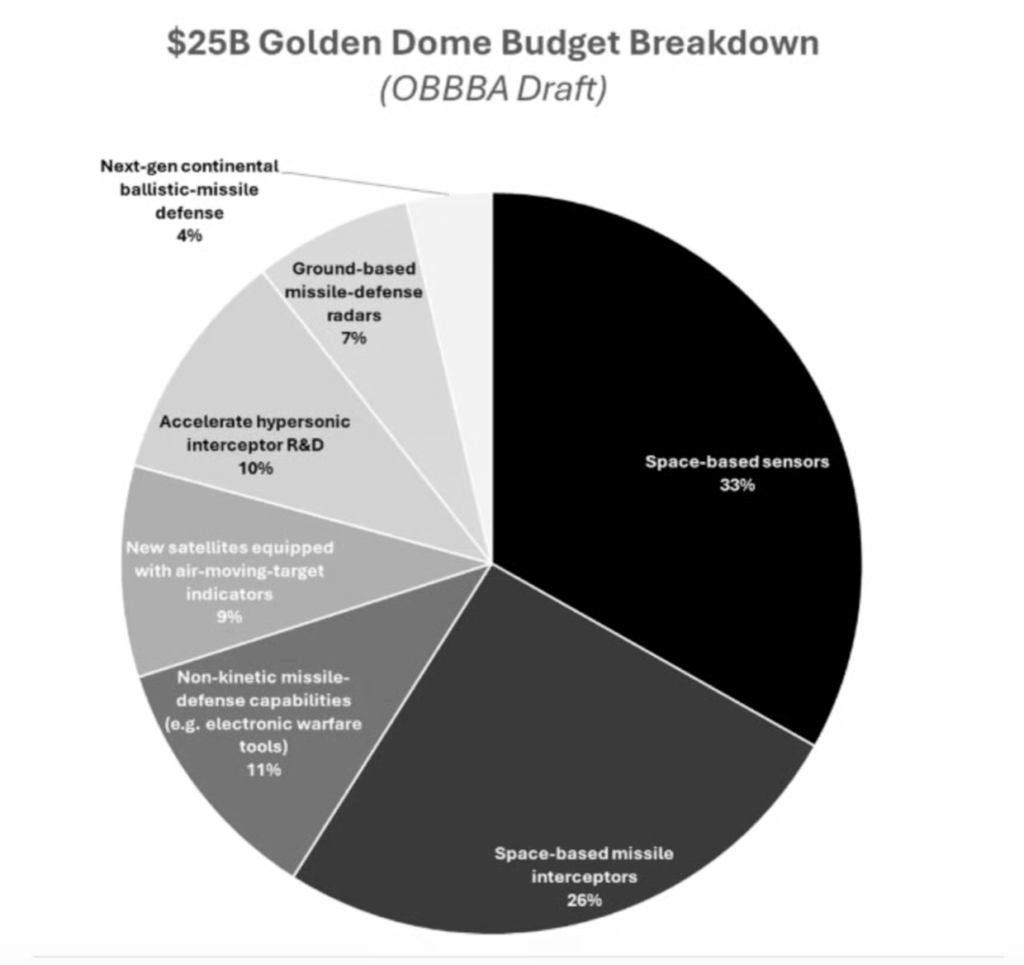
6. American Golden Dome Budget
MarketWatch
7. Big Gap in the Sky
Flightradar
Via Morning Brew: The Israel–Iran conflict has made vast swaths of airspace out of bounds for commercial aircraft in recent days, highlighting how the rising prevalence of wars is scrambling air travel.
A live flight map on FlightRadar24 displays a gaping hole in the plane swarms above Israel, Iraq, and Iran. Many airlines have also nixed flights to nearby hubs like Dubai and Doha as tensions escalate across the region.
Passengers have been stranded, while airlines face revenue losses and higher costs from longer, rerouted flights that burn more fuel. As a tenuous Israel–Iran ceasefire took hold yesterday, air carriers began restoring some flights in the region, while European and US airline stocks rose sharply.
But no-fly zones persist
Aviation issues didn’t start with the most recent conflagration:
Parts of the Middle East are still off limits to aircraft, while a planeless territory has existed over Ukraine and parts of western Russia since the war between the two countries began in 2022.
The square mileage of conflict zones has increased by 65% since 2021, according to risk consulting company Verisk Maplecroft.
This makes piloting harder…as flight reroutes lead to more crowded skies, creating congestion and straining control tower resources. Pilots flying near warzones also have to contend with GPS jamming, forcing them to rely on experience to gauge location and altitude.
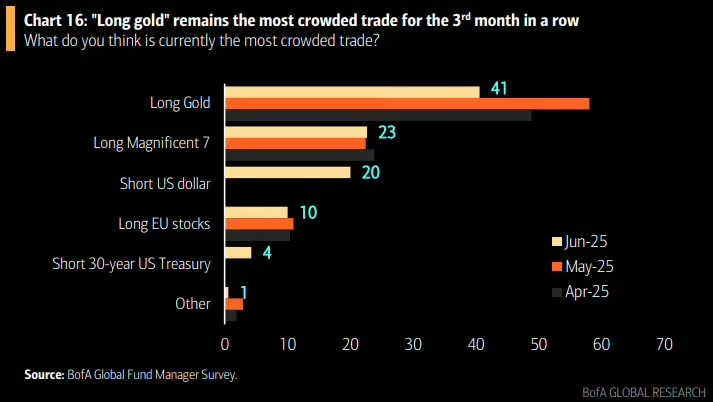
Crowded trades. ‘Long gold’ remains the most crowded trade (3rd consecutive month) followed by ‘Long Mag7’ and ‘Short USD’.
BofA via mikezaccardi
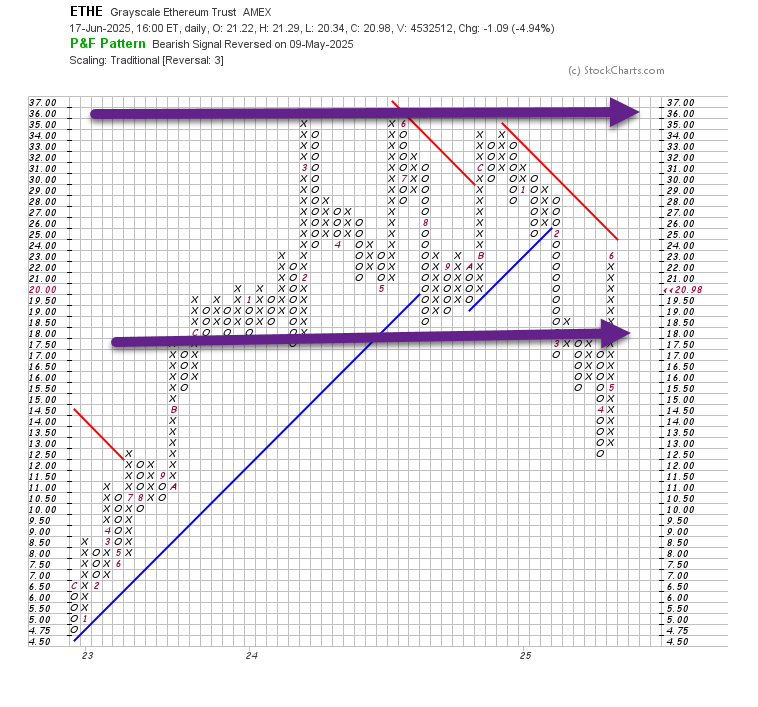
3. Ethereum ETF Big Rally Off Lows…Right Back into Range 2023-2025
StockCharts
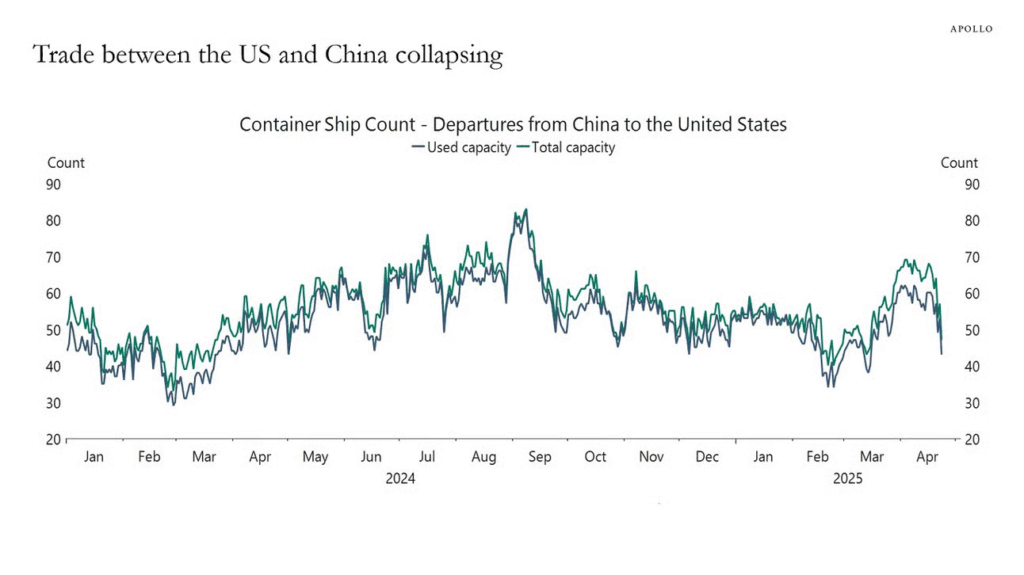
4. Trade Between U.S. and China Rolling Over Hard
Ritzholz
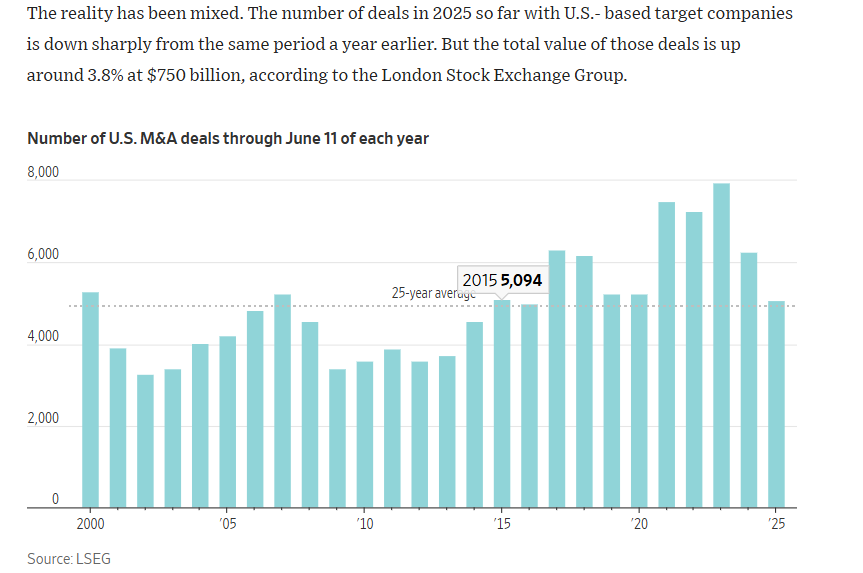
5. M&A Deals Down But Total Value +3.8%
FinChart
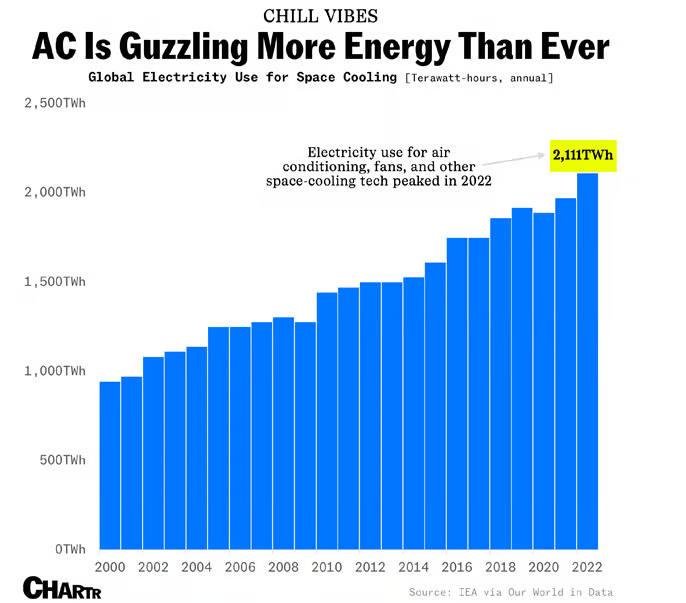
6. More Demand from Energy Grid…Summer AC Use at Records
Sherwood
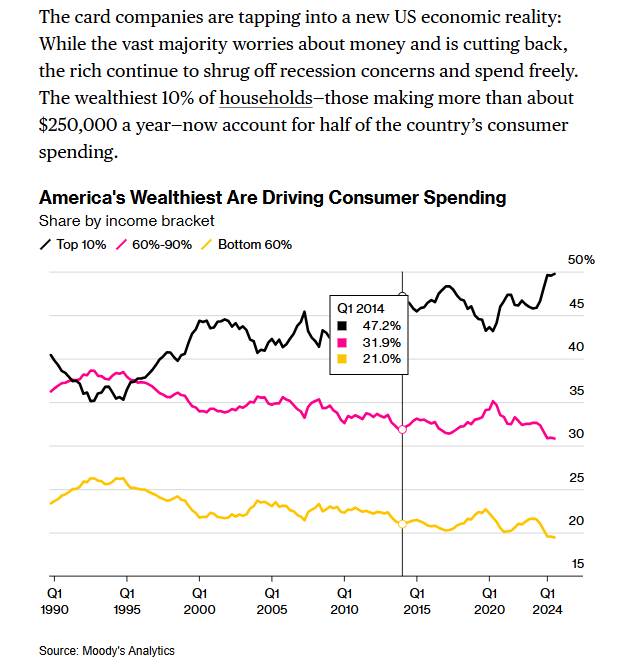
7. Wealthiest 10% Now Account for Half of U.S. Consumer Spending
Bloomberg
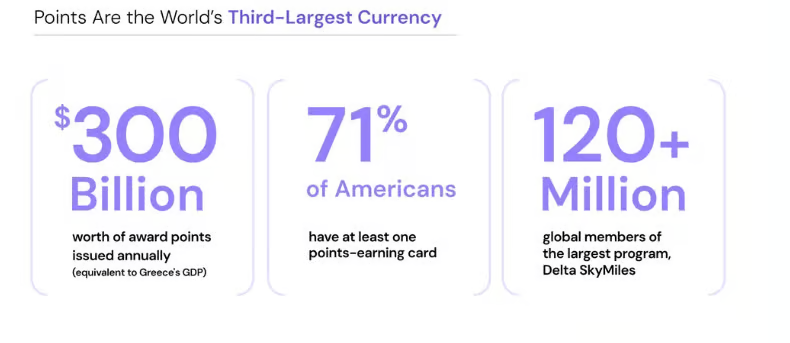
8. Credit Card Points are the World’s Third-Largest Currency
Point.Me
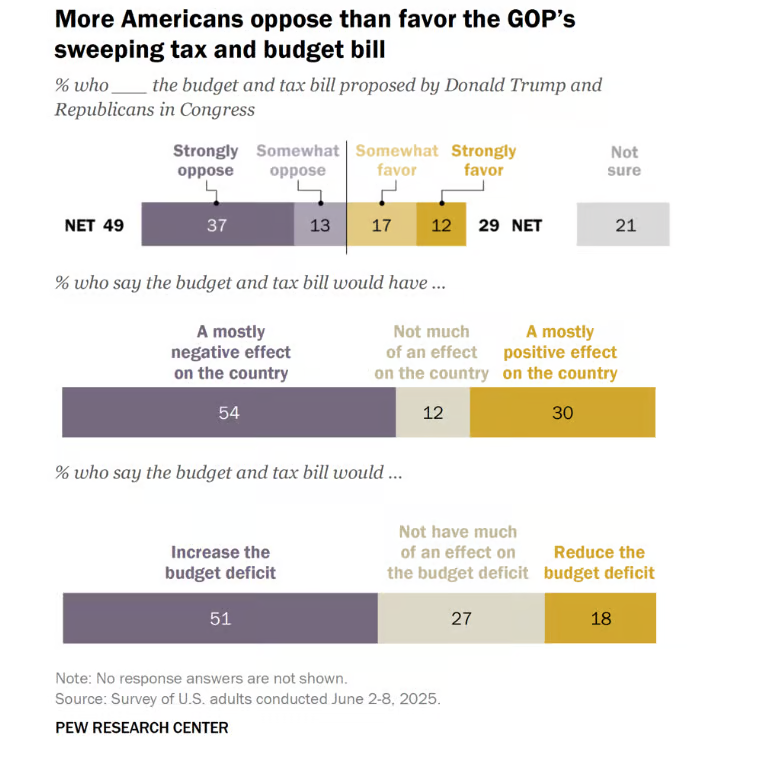
9. Pew Research on Budget Bill
Pew Research Center
10. Every Leader Should Be a Student of Psychology
To lead well, one must understand what drives and influences relationship.
Key points
Leadership is inherently relational, not positional, and technical skills alone are not enough.
Emotional intelligence is foundational to leadership success.
The study of psychology should be a deliberate practice for leaders.
Via Psychology Today: There’s a pervasive myth that still lingers in leadership classrooms: the idea that good leaders are simply born with presence, confidence, and instinct. While those traits may help some individuals ascend to positions of authority, they are insufficient for navigating the human complexities that leadership demands. To be effective in today’s ever-evolving organizational landscape, leaders must be students of psychology (in both principle and practice) if they hope to lead effectively.
About Leadership
Three things matter in Leadership: Relationships, Relationships, and Relationships. Leadership is, at its core, a relational practice. It is not about authority (or positional power); it is about influence. And influence is rooted in an understanding of human behavior, motivation, emotion, and interaction. It is important that a leader understand the behavior of others as well as their own.
As I often remind students and colleagues alike, no matter how technically skilled a leader may be, their impact is limited if they cannot connect with, motivate, and adapt to the emotional and psychological needs of their teams. In the program I direct at Teachers College, Columbia University, we require students to take two foundational courses that emphasize this belief: Self-Awareness Training and Social-Emotional Learning.
One of the most foundational psychological principles in leadership is emotional intelligence (EI), a concept introduced by Mayer and Salovey1 and later popularized by Daniel Goleman. Goleman’s research demonstrated that EI contributes more to workplace success than IQ, particularly in high-pressure environments2. Why is that the case? Emotionally intelligent leaders can perceive and regulate their own emotions (especially during stressful moments), empathize with others’ experiences, build trust, and de-escalate conflict.
A study conducted in Palopo, Indonesia, for example, revealed that school leaders with high EI had a direct and positive impact on teacher performance. This success stemmed from their capacity to recognize emotions, manage relationships, and create workplace harmony3.
In practical terms, when individuals feel seen, understood, and supported, their ability to perform and collaborate improves significantly.
Why This Matters
We are living in a time defined by constant change, social complexity, and new demands on leadership. Today’s teams are more diverse, geographically distributed, and dynamic than ever before. Leaders who understand the psychology of their people are more likely to foster positive cultures, reduce conflict, and increase performance/productivity4.
Those who use emotional intelligence and motivational theory to inform their leadership behaviors are not only better equipped to lead diverse teams but also more capable of sustaining organizational well-being over time. The most effective leaders going forward will not necessarily be those with the loudest voices or the most polished résumés. They will be those who understand how people think and feel, who communicate in ways that resonate, and who create environments in which people feel psychologically safe. These are not “soft skills” (as often labeled). They are critical survival skills for effective leadership through today’s challenges.
If you are in a leadership role (or aspire to be in one), consider this your invitation to become a student of psychology. Not for the sake of theory, but for the sake of better practice. Start by exploring the basics: emotional intelligence, motivational theory, and self-awareness. Read. Reflect. Ask better questions. Challenge your assumptions. And above all, lead with curiosity and compassion.
Leadership is not about you. It is about those you serve. And understanding the psychology of leadership may be one of the most powerful tools you can include in your box.
1. Watch for Short-Term Bounce in Dollar…Too Many Bears
A Wealth of Common Sense
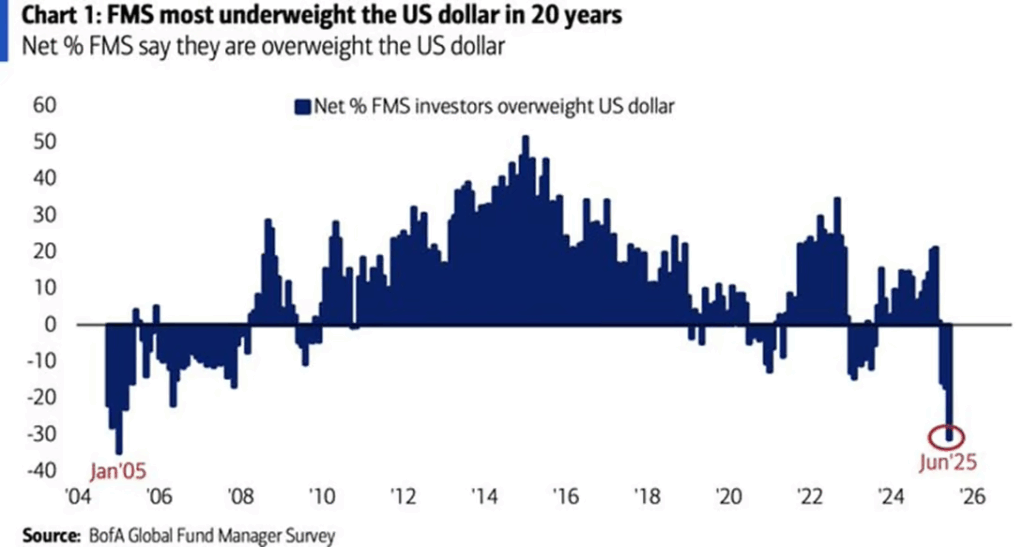
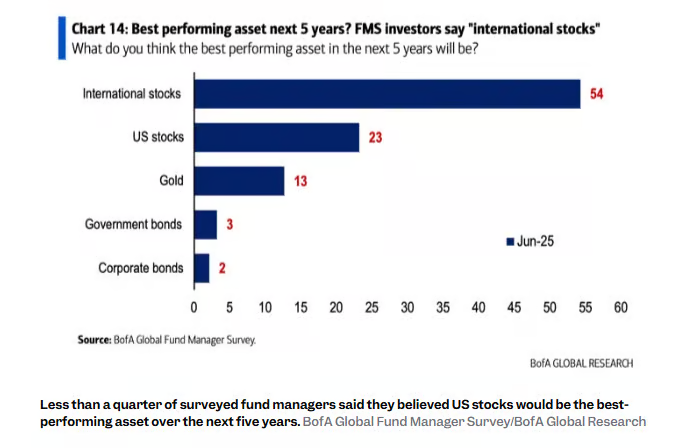
2. Consensus Weak Dollar and Majority Think International Stocks Outperform?
Bloomberg
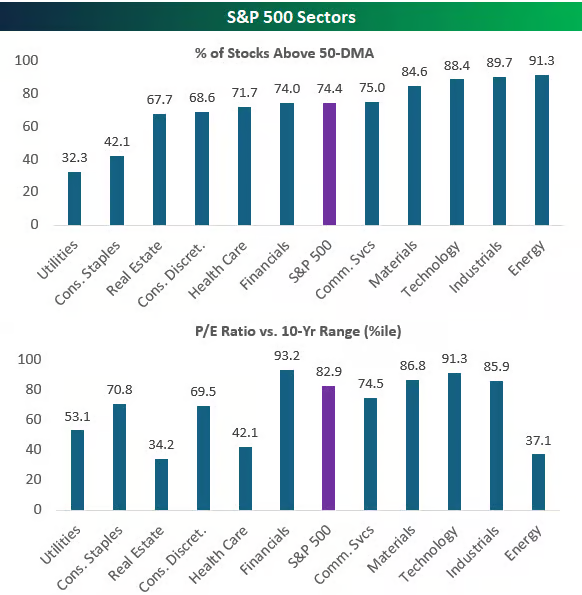
3. S&P Sectors % Above 50day and P/E Valuation vs. 10-Year Average
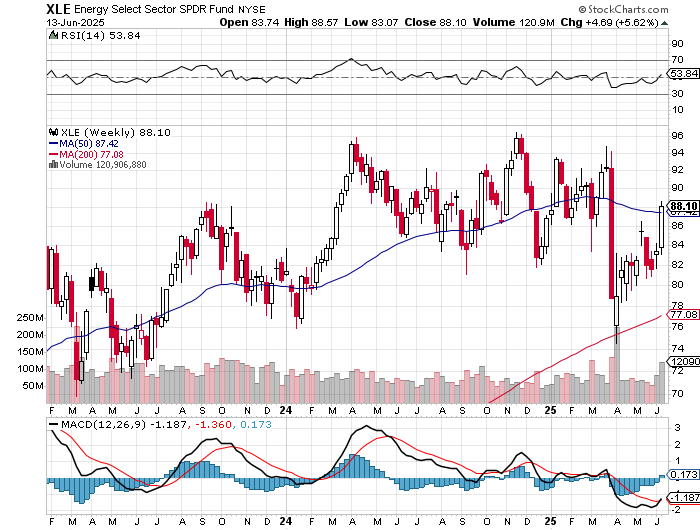
Bespoke Investment Group Looking at sectors, Energy now has the highest percentage of stocks above their 50-day moving averages at 91.3%, and the Energy sector’s valuation relative to the last ten years is on the low side compared to the rest of the market. Financials and Technology currently have the highest valuations relative to readings over the last ten years.
Bespoke
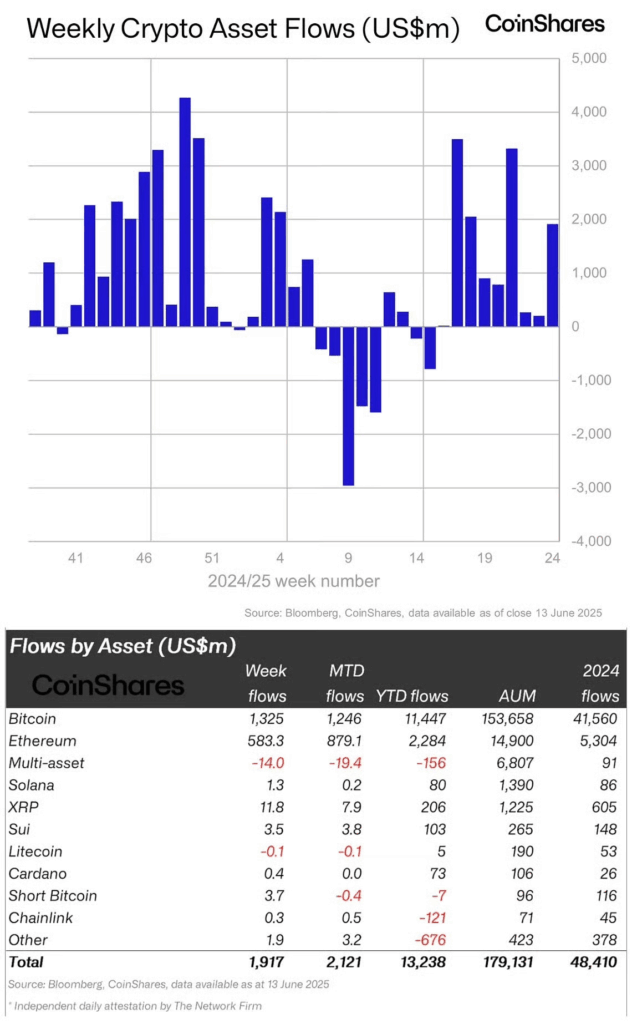
4. Weekly Crypto Asset Flows
Crypto asset flows. “Digital asset investment products saw US$1.9bn in inflows last week, marking the 9th consecutive week and a record YTD total of US$13.2bn. Bitcoin rebounded with US$1.3bn in inflows, while Ethereum saw US$583m inflows, its strongest since February.”
Paychart Books
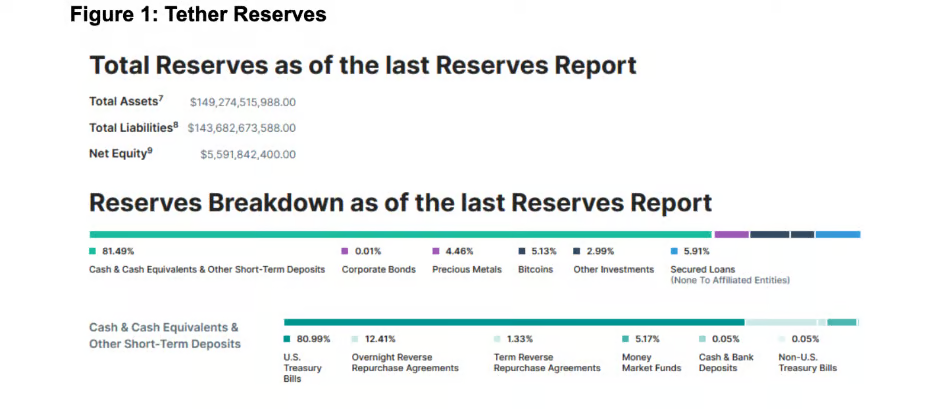
5. Tether Reserves Breakdown
FinChart
6. JPMorgan moves further into crypto with stablecoin-like token JPMD
Key Points
U.S. banking giant JPMorgan is launching its alternative to a stablecoin called JPMD.
The new product is a so-called deposit token that’s designed to serve as a digital representation of commercial bank money.
JPMorgan said the benefit of launching a deposit token over a stablecoin is the close connection with traditional banking systems.
Via CNBC: JPMorgan Chase is taking a step further into the cryptocurrency space with its own stablecoin-like token, called JPMD.
The U.S. banking giant told CNBC on Tuesday that it’s planning to launch a so-called deposit token on Coinbase’s public blockchain Base, which is built on top of the Ethereum network. Each deposit token is meant to serve as a digital representation of a commercial bank deposit.
JPMD will offer clients round-the-clock settlement as well as the ability to pay interest to holders. It is a so-called “permissioned token,” meaning it is only available to JPMorgan’s institutional clients — unlike many stablecoins, which are publicly available.
“We see institutions using JPMD for onchain digital asset settlement solutions as well as for making cross-border business-to-business transactions,” Naveen Mallela, global co-head of Kinexys, J.P. Morgan’s blockchain unit, told CNBC Tuesday.
“Given the fact that deposit tokens would eventually be interest bearing as well, this would provide better fungibility with existing deposit products that institutions currently use,” he added.
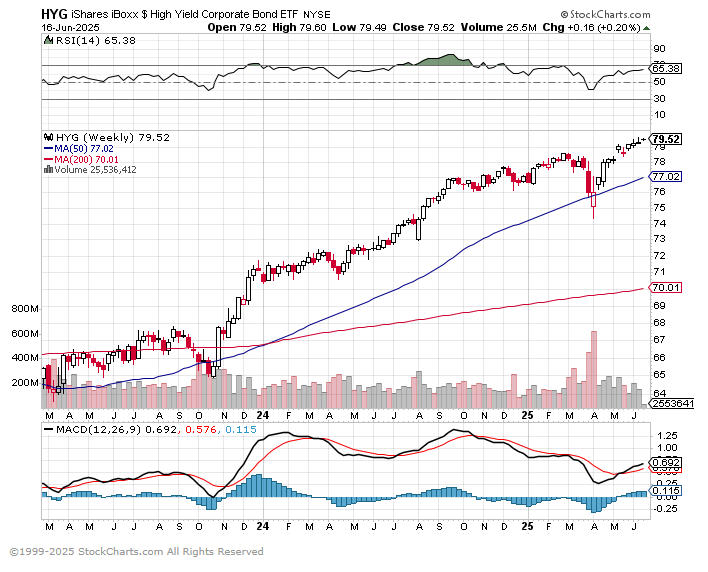
7. High Yield Bond ETF New Highs
StockCharts
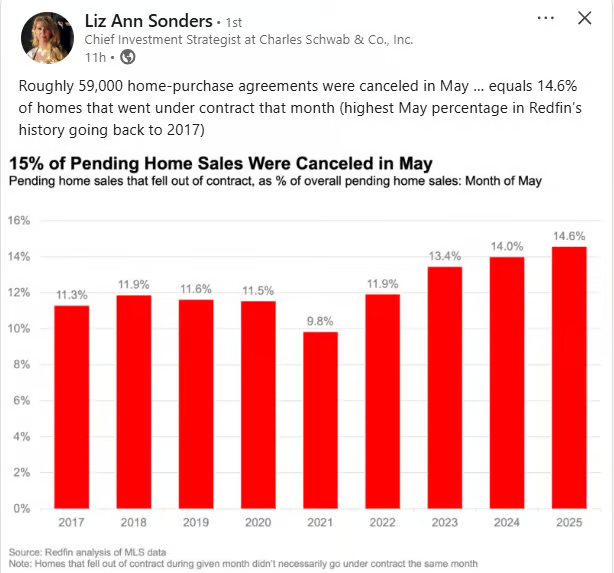
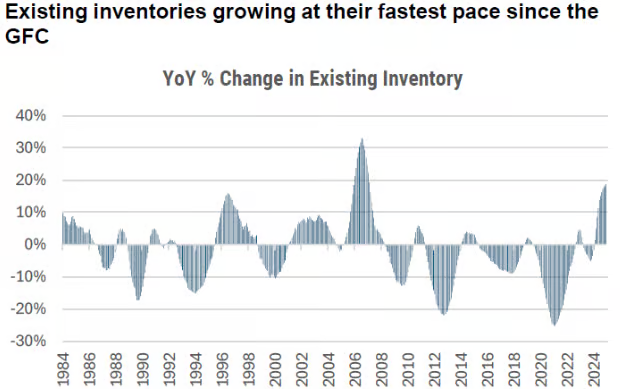
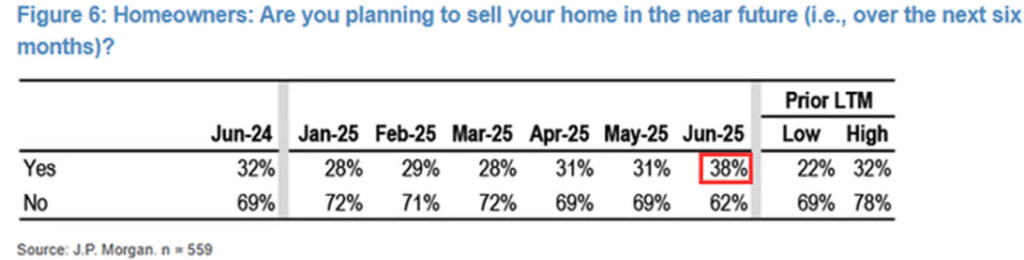
8. Home Inventory Increasing and Number of Owners Planning to Sell in Next 6 Months
Joe notes that we haven’t seen inventory build up anything like this since the GFC. And outside that, nothing else in the last 40 years.
Dave Lutz Jones Trading
The JPM survey sees a jump in homeowners planning to sell in the next ~6 months.
9. Metros with Home Prices Going Negative
The growing list of year-over-year price declines-Wolf Street.
In May, the list of year-over-year decliners got a new member, Seattle. In total, of the 33 MSAs here, 18 show year-over-year declines, up from 6 at the end of 2024. In all of those 18 metros, the year-over-year declines worsened.
Year-over-year declines in May:
Austin: -5.5%
Tampa: -5.5%
Dallas: -3.4%
Phoenix: -3.4%
San Antonio: -3.3%
Orlando: -3.2%
Miami: -3.2%
Atlanta: -2.7%
San Francisco: -2.5%
Denver: -2.4%
San Diego: -1.9%
Raleigh: -1.8%
Honolulu: -1.7%
Houston: -1.5%
Sacramento: -1.4%
Charlotte: -0.9%
Portland: -0.5%
Seattle: -0.1% (newest addition)
10. Your Morning Coffee Can Help You Live Longer — As Long As It’s This Type Of Brew
Coffee carries life-lengthening health benefits, but not if you’re adding flavors and creams to it.
In a nutshell:
Coffee drinkers who consumed 1-3 cups daily had a 15-17% lower risk of dying early compared to non-coffee drinkers
Health benefits only applied to black coffee or coffee with minimal added sugar (less than half a teaspoon per cup) and saturated fat
Coffee drinks high in sugar and saturated fat showed no protective effects, potentially eliminating coffee’s health benefits entirely
Via Study Finds: Americans love their coffee, with about half of us reaching for a cup every single day. And here’s some news that might make your morning brew taste even better: that daily coffee habit could be cutting your risk of dying early by up to 17% — but there’s a catch that could cancel out the benefits.
A study tracking nearly 50,000 American adults for more than a decade found that coffee drinkers lived longer than those who skipped their daily caffeine fix. The twist? The life-extending benefits were only seen in people who drank black coffee or coffee with very little added sugar and saturated fat. Those sugary, creamy coffee shop drinks? They offered no measurable health advantage.
According to the study, coffee with higher levels of added sugar and saturated fat was not associated with lower death rates. Moreover, the benefits were not seen in people who preferred a decaf brew. The research took a detailed look at what Americans are actually putting in their coffee, and the findings raise red flags about our sweetened coffee culture.
Nearly 50,000 Americans Tracked for Over a Decade
Researchers from Tufts University analyzed coffee drinking habits and health outcomes in 46,322 adults aged 20 and older who participated in U.S. government health surveys between 1999 and 2018. Participants were followed for roughly 9 to 11 years, with actual mortality outcomes tracked using National Death Index records.
During that time, 7,074 participants died — 1,176 from cancer and 1,089 from cardiovascular disease. Compared to non-coffee drinkers, those who drank coffee had significantly lower mortality rates. The greatest benefit appeared in people drinking 2 to 3 cups a day, who had a 17% lower risk of dying during the follow-up period. Even those who drank less than a cup a day saw an 11% lower risk.
Why Sweetened Coffee May Cancel the Health Benefits
The researchers also examined what went into those cups of coffee. Each beverage was classified based on how much added sugar and saturated fat it contained per 8-ounce serving.
Drinking black coffee was associated with a 14% lower risk of all-cause mortality. Coffee with small amounts of added sugar (under 2.5 grams per cup) and saturated fat (under 1 gram per cup) also showed the same 14% reduction.
But for people drinking coffee with higher amounts of sugar and saturated fat, there was no statistically significant reduction in risk of death. For context, the average U.S. coffee drink contains 3.24 grams of added sugar and 0.52 grams of saturated fat per 8-ounce cup, suggesting that many Americans are overshooting the threshold where coffee may offer health benefits.
Caffeine Key to Longevity
The study, published in The Journal of Nutrition, also found that caffeinated coffee — not decaf — was driving most of the observed health benefits. While decaffeinated coffee showed no clear association with longevity, caffeinated coffee was linked to reduced risk of death from both all causes and cardiovascular disease.
That’s in line with previous research suggesting that caffeine may play a protective role by boosting metabolism, reducing inflammation, and improving insulin sensitivity. Coffee also contains other bioactive compounds like chlorogenic acid and polyphenols that are thought to have antioxidant and anti-inflammatory effects.
Interestingly, the protective effects of coffee were only observed among people who did not drink tea. Among tea drinkers, the association between coffee and longevity disappeared, though the study doesn’t explain why.
It’s Best To Be Basic
For the estimated 150 million Americans who drink coffee daily, this study delivers both a bit of good news and a wake-up call. The good news: your coffee habit could be helping you live longer. The reality check: if your go-to drink includes lots of sugar, cream, or flavored syrups, those potential benefits may be lost.
Researchers adjusted for a wide range of lifestyle and health variables, including age, sex, race, income, smoking, alcohol use, exercise, diet quality, and preexisting conditions. Even then, the association between simple coffee and lower mortality still held up.
The takeaway? A basic cup of coffee, especially when consumed black or lightly sweetened, may be one of the healthiest parts of your day. But when that cup starts to resemble dessert and doesn’t have caffeine, the health perks may disappear.
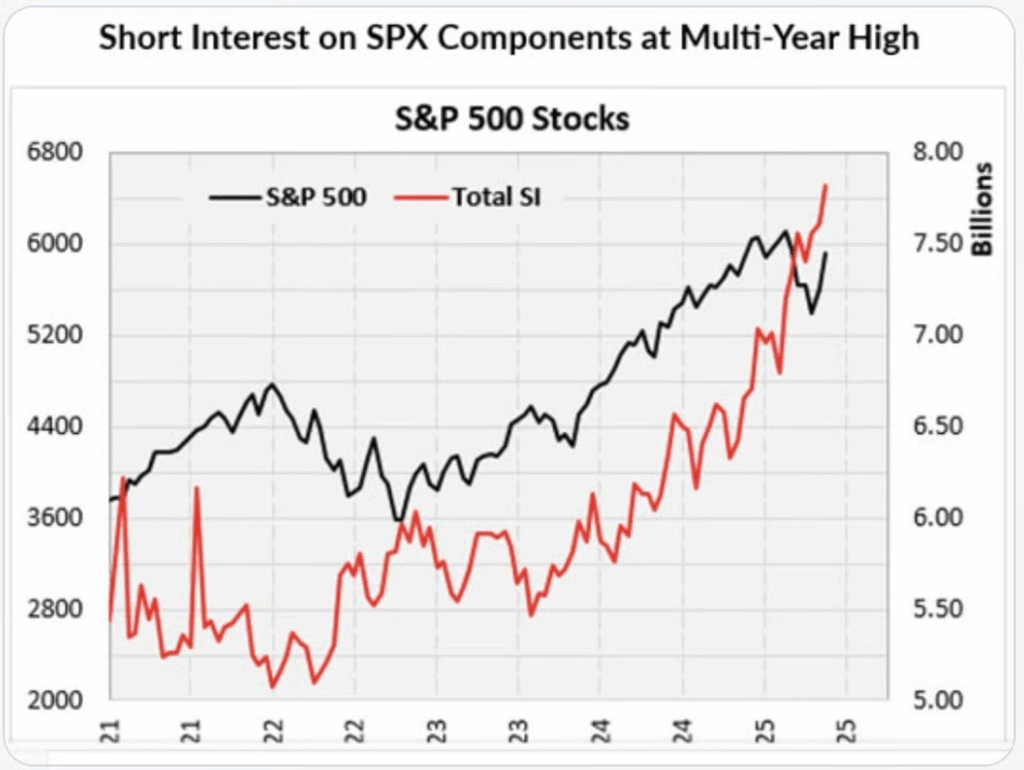
Short interest still sits a multi-year highs while the S&P 500 sits only about 2% from new all-time highs.
Short interest represents future buying power, with squeeze situations increasing during rallies.
Source: Seth Golden @Callum Thomas (Weekly S&P500 #ChartStorm)
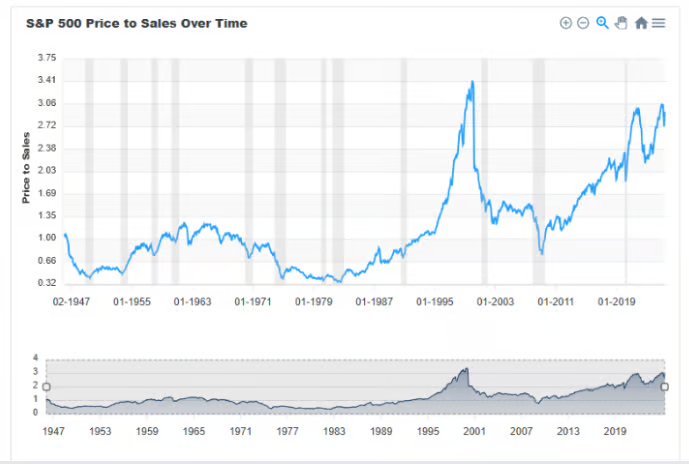
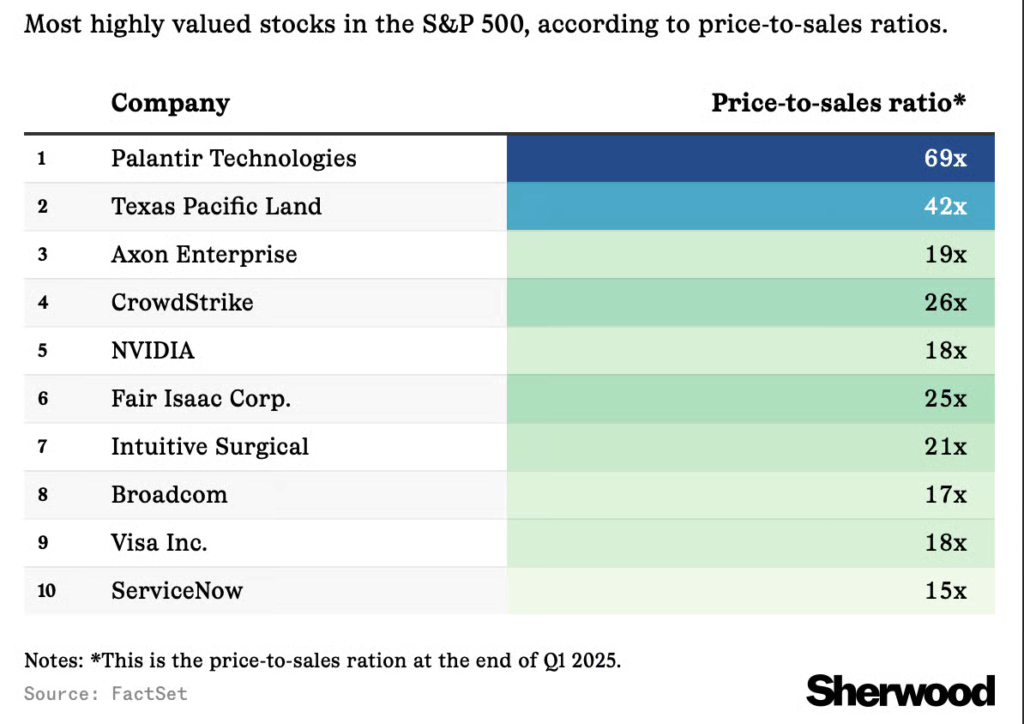
3. Highly Valued Stocks Based on Price to Sales
Sherwood News
4. Energy Sector ETF Still Below 2024 Highs
StockCharts
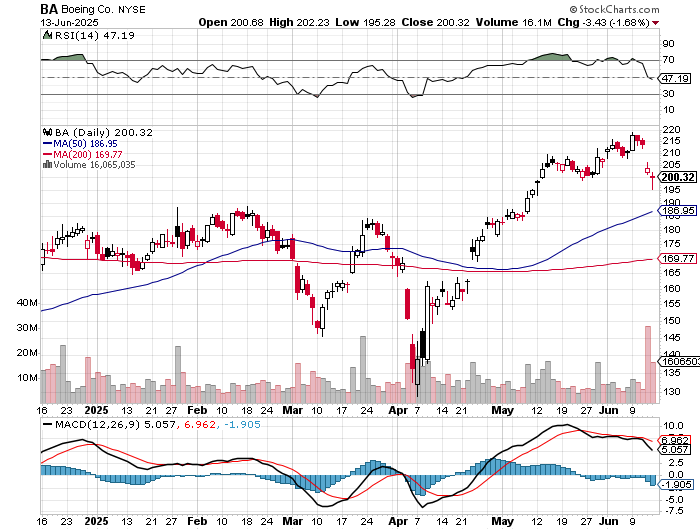
5. Post India Plane Crash….Boeing +16% Year to Date and Well Above 200-Day
StockCharts
6. Quora and Reddit Most-Cited Sources in Google AI Reviews
Via Business Insider: Reddit is the 2nd most-cited source in Google AI Overviews, but that might not mean much for its bottom line.
Analytics firm Semrush studied how AI is affecting Google Search traffic.
It found that Reddit is the second most-cited website by Google AI Overviews.
Quora was the most cited source.
Reddit’s relationship with Google is complicated.
The social media forum, which went public last yearand is under pressure like never before to attract advertisers and turn a profit, has recently enjoyed priority status on Google Search.
And now that Google has launched its AI Overview, a natural language synopsis of search results at the top of the page, it seems its preference for citing Reddit remains.
Analytics firm Semrush shared data this month on how AI-powered search is affecting traffic. It found that Reddit is the second most-cited website in Google AI Overviews, following Quora.
“Quora and Reddit users often ask and answer niche questions that aren’t addressed elsewhere. Making them rich information sources for highly specific AI prompts,” the study’s authors wrote. “Reddit may also perform well because Google has a partnership with Reddit and uses Reddit data to train its systems.”
Reddit and Google entered a partnership, worth a reported $60 million, in 2024 that allowed Google to train its AI models on Reddit’s content. Google said the deal would “facilitate more content-forward displays of Reddit information.”
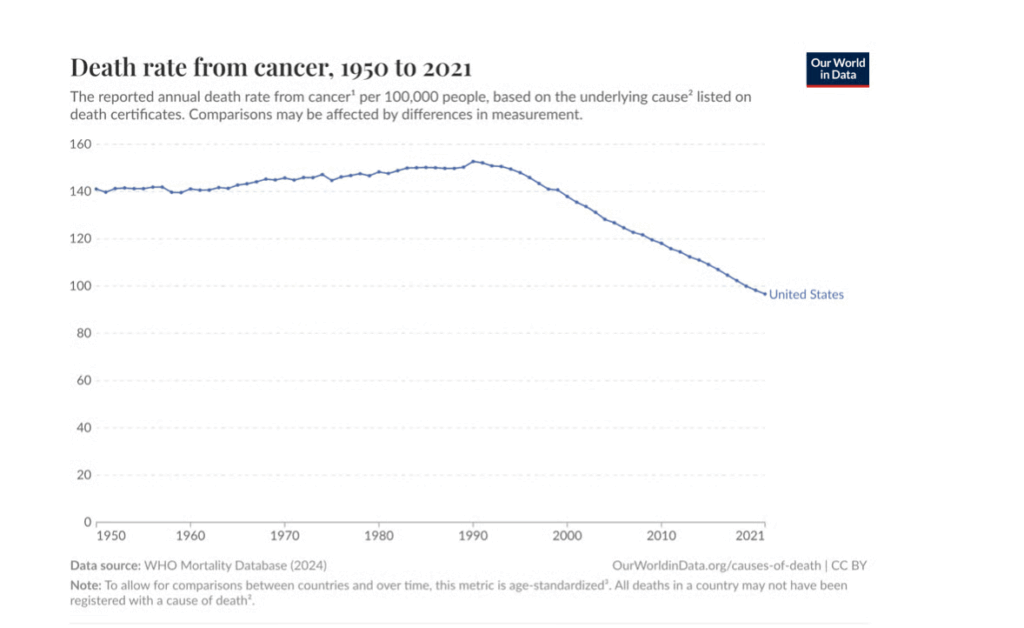
7. Death Rates from Cancer Declining
Vox
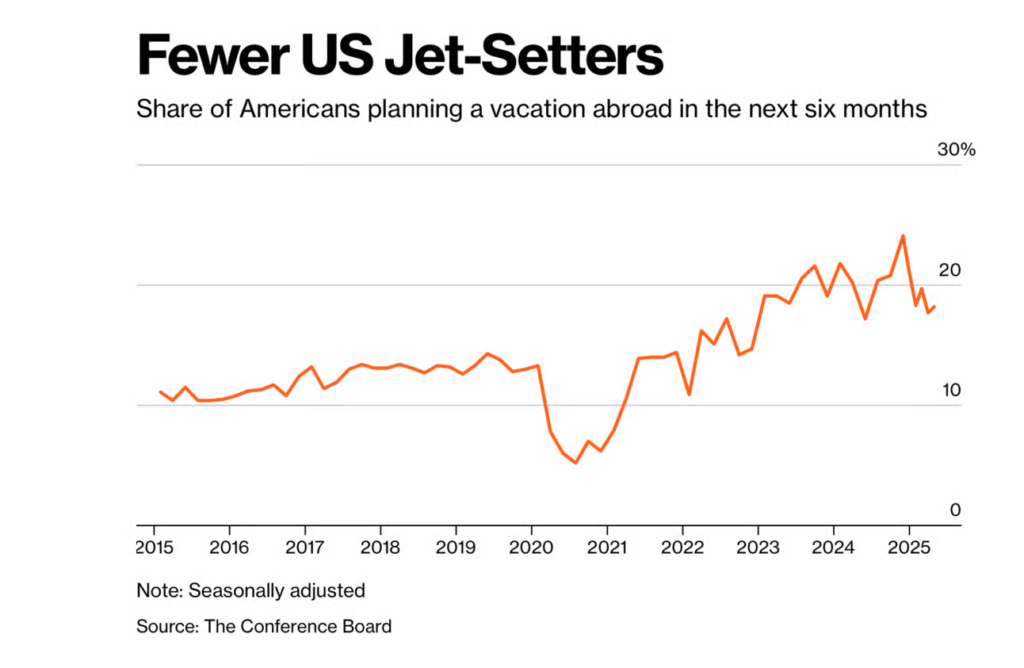
8. Americans Traveling Abroad this Summer
Bloomberg
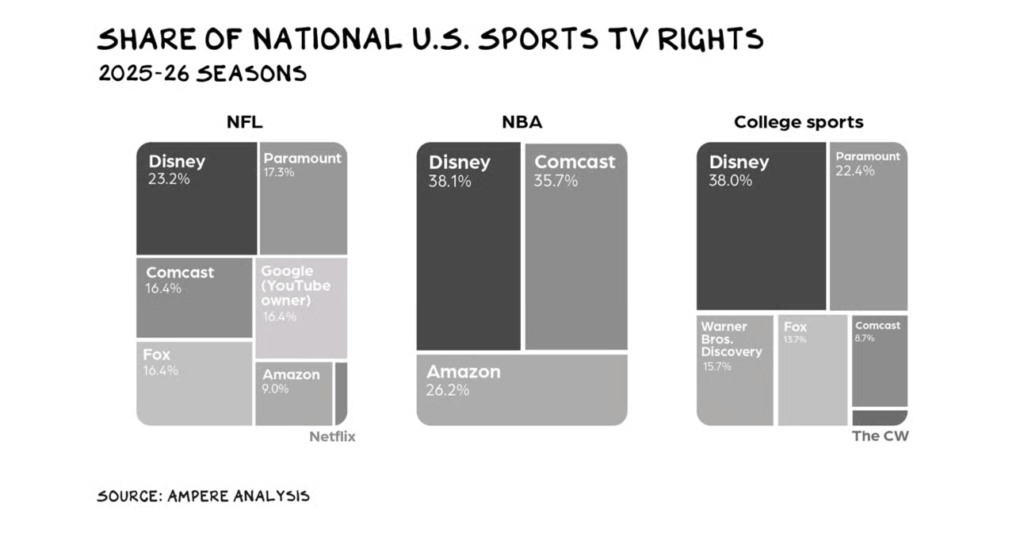
9. Share of National U.S. Sports TV Rights-Prof G
Professor Galloway
10. Morning and Nights
Via the FS Blog:The entire self-help industry in one sentence: Do what makes mornings exciting and nights peaceful.
Will this make me excited to wake up? Will this let me sleep in peace?