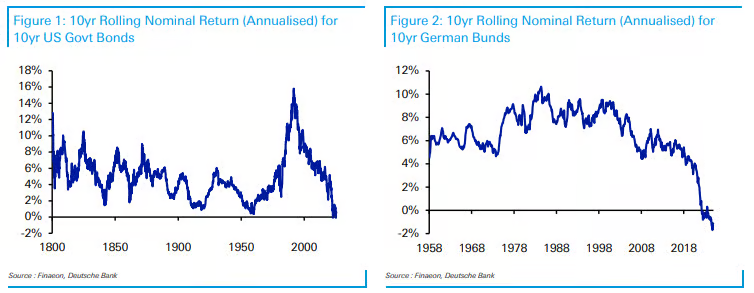
One section of the pack shows how this has been the worst decade for government bonds across the globe on record, at least in nominal terms, although in real terms it’s still one of the worst. In today’s CoTD we show this for 10yr US govt bonds (or equivalents) back over 200 years, and for 10yr Bunds over the last 70 years. In the pack we also show the real adjusted graphs and also include the same for 30yr USTs, 10yr JGBs, 10yr Gilts and 10yr OATs.
Jim Reid Deutsche Bank
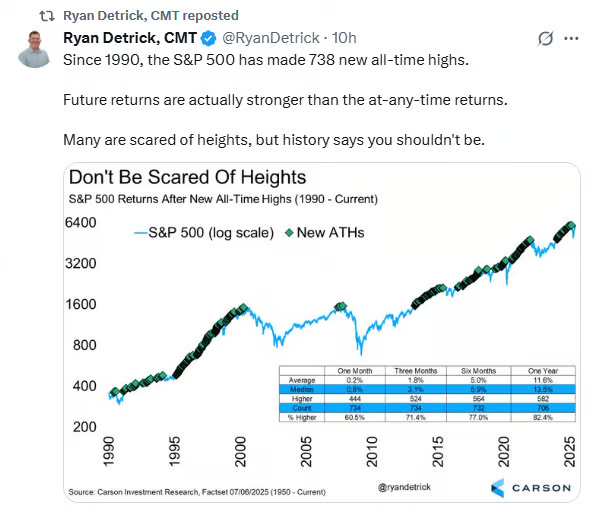
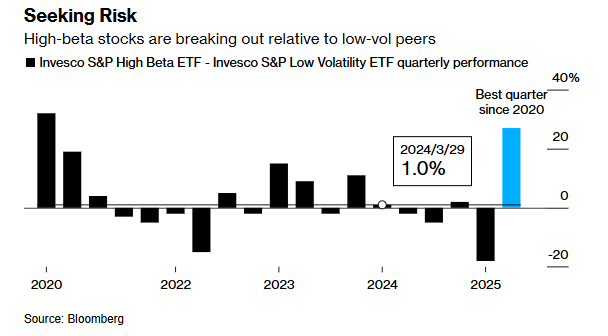
3. New Highs are Not Bearish
Ryan Detrick
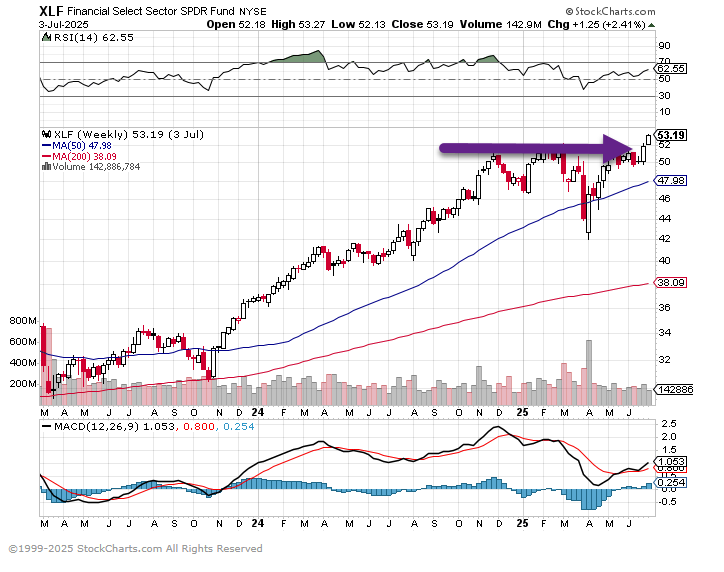
4. XLF Financial Sector ETF Hits New Highs…Deregulation and Bet on Lower Rates?
StockCharts
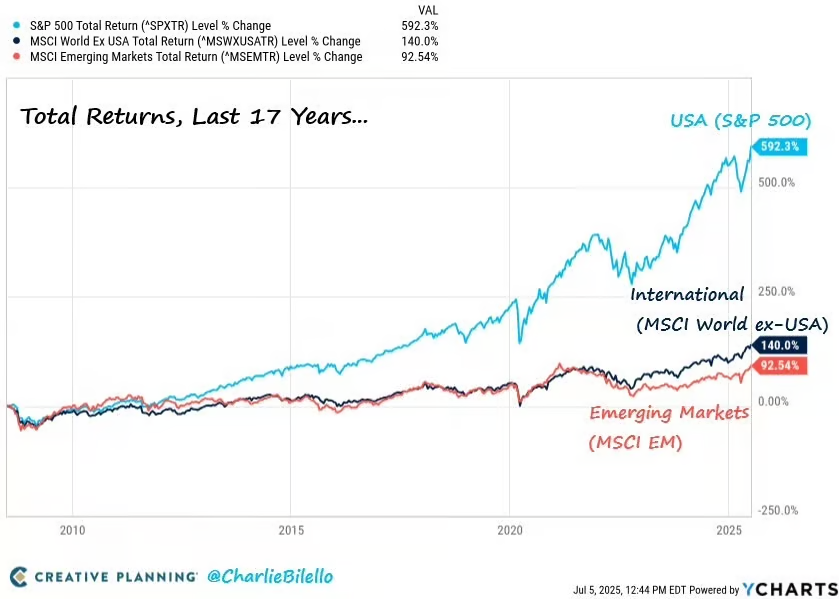
5. International Stocks Over 17 Years
Over the last 17 years, US stocks have gained 592% versus 140% for International stocks and 93% for Emerging Markets.
Charlie Bilello
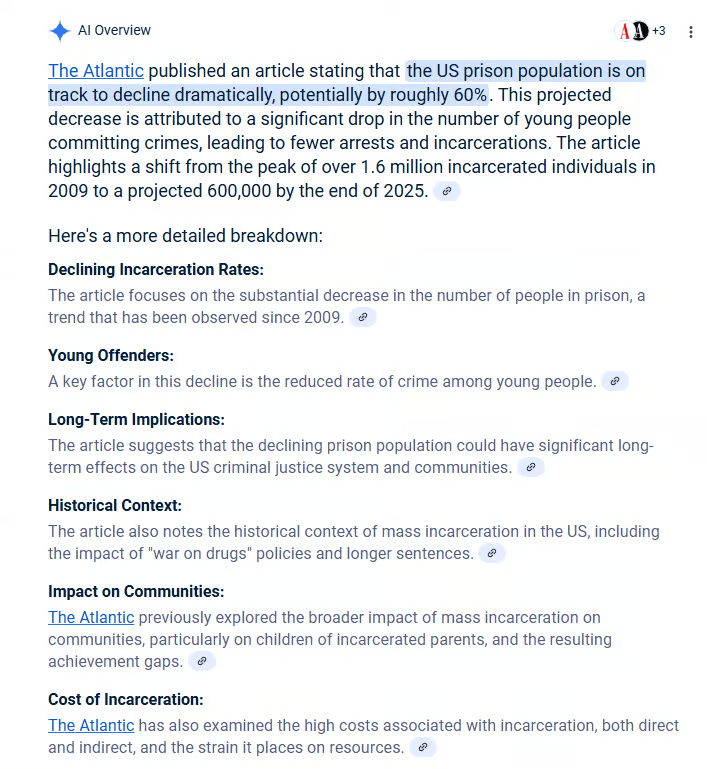
6. America’s Prison Population About to Fall Off Cliff
The Atlantic
Google
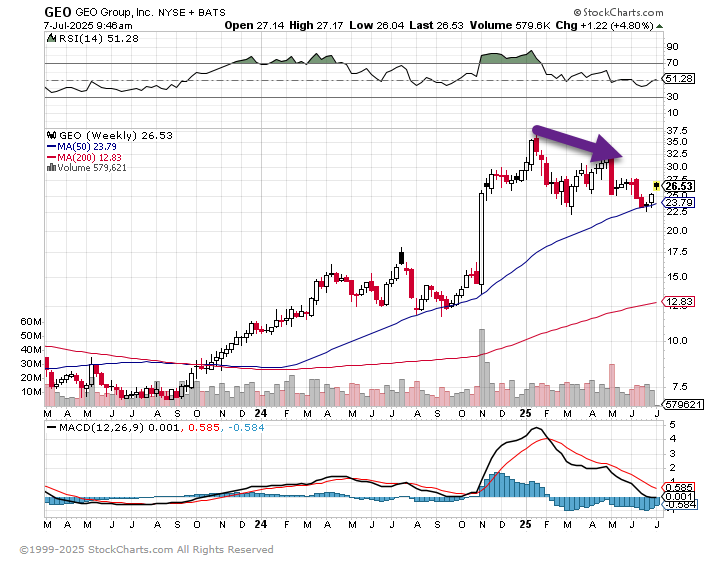
7. GEO Big Rally on Trump Election…-35% Correction from High
StockCharts
8. Internal Divisions at BRICS Summit…Half the Group’s Leaders Did Not Attend
Semafor
This weekend’s BRICS summit in Brazil put a spotlight on the growing internal divisions within the bloc of developing nations. About half of the group’s leaders, including China’s Xi Jinping and Russia’s Vladimir Putin, didn’t attend the gathering. While BRICS has expanded from five members — Brazil, Russia, India, China, and South Africa — to 11 in the last two years, the additions have brought fresh points of contention, and perhaps diluted its clout. Delegates avoided any controversial subjects that might trigger Washington’s ire, analysts said: A joint declaration condemning tariffs refrained from naming US President Donald Trump, and mentioned Ukraine only once. It marked a contrast from last year’s gathering in Russia, where the Kremlin pushed for alternatives to US-dominated financial systems.
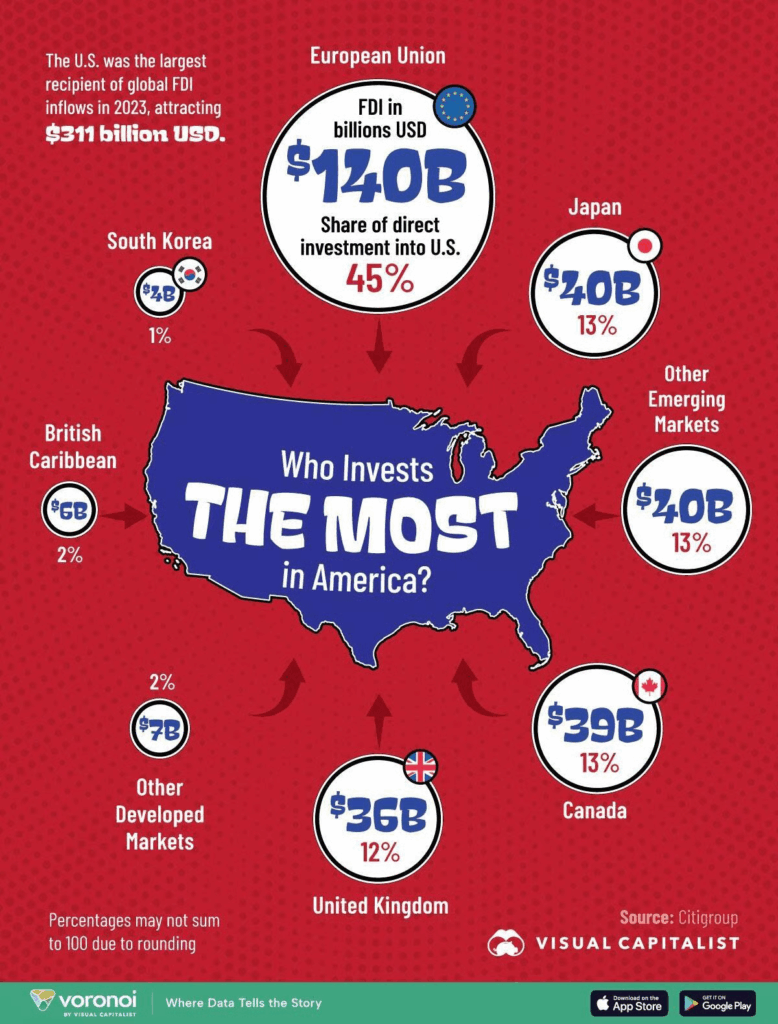
9. Foreign Direct Investment into U.S. by Country/Region
This graphic, via Visual Capitalist’s Kayla Zhu, visualizes foreign direct investment (FDI) into the U.S. by country or region of origin in 2023.
ZeroHedge
10. Not smart vs. stupid
Via Seth’s Blog: Not smart is a passive act, remedied with learning, experience and thought.
Stupid is active, the work of someone who should have or could have known better and decided to do something selfish, impulsive or dangerous anyway.
The more experience, assets and privilege we have, the less excusable it is to do stupid things. And at the same time, the more useful it is to announce that we’re not smart (yet).
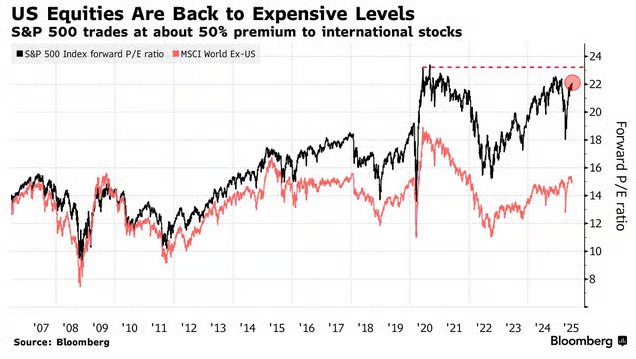
2. U.S. Stocks Back to 50% Premium Over International
Bloomberg
3. Nvidia insiders dump $500 Million in Stock Last 30 Days
Key Points
Insiders at artificial intelligence chipmaker Nvidia have dumped more than $1 billion in stock over the last year, according to a Financial Times report.
About half of those sales occurred during the last month as the market notched new highs and shook off geopolitical tensions.
Last week, the chipmaking giant hit a fresh record and rallied for five straight days following stock sales by CEO Jensen Huang and Nvidia’s annual shareholder meeting.
Via CNBC: Insiders at artificial intelligence chipmaker Nvidia have dumped more than $1 billion in stock over the last year, according to a report from the Financial Times.
About $500 million worth of sales occurred over the last month as the market notched new highs and shook off geopolitical tensions that had rattled investors, according to the report. The stock is up more than 17% this year despite concerns over curbs limiting AI chip sales overseas and 44% over the last three months.
Securities filings revealed that the tech titan recently unloaded about $15 million worth of shares as part of his more than $900 million plan announced in March to sell up to 6 million shares through the end of the year. Huang’s net worth totals about $138 billion, placing him as 11th on the Bloomberg Billionaires Index.
Last week, the chipmaking giant hit a fresh record and rallied for five straight days following the stock sales and an annual shareholder meeting, where the CEO called robotics the biggest opportunity for the company after AI. That helped the chipmaker regain its seat as the most valuable company ahead Microsoft and Apple.
The FT article cited a report from VerityData, which noted that the jump in shares above $150 prompted the stock dump.
Last year, Huang unloaded more than $700 million in Nvidia shares as part of a prearranged plan.
A spokesperson for Nvidia declined to comment on the report.
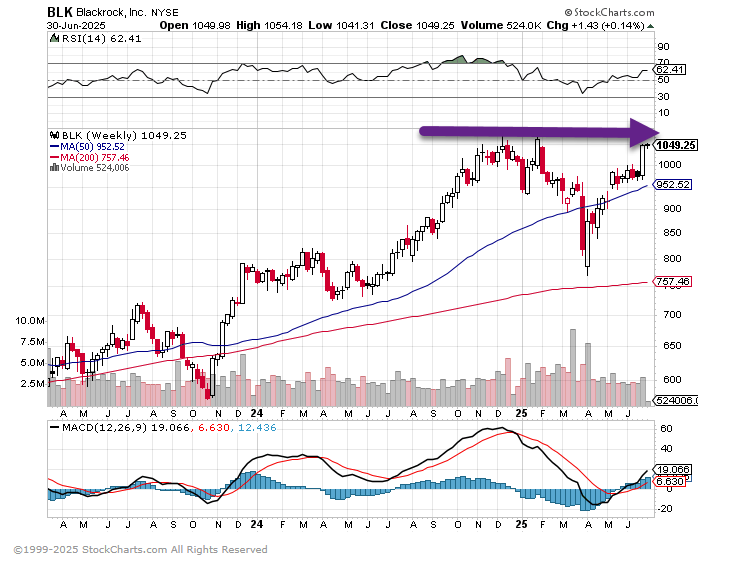
4. Blackrock One Tick from New Highs
Barron’s
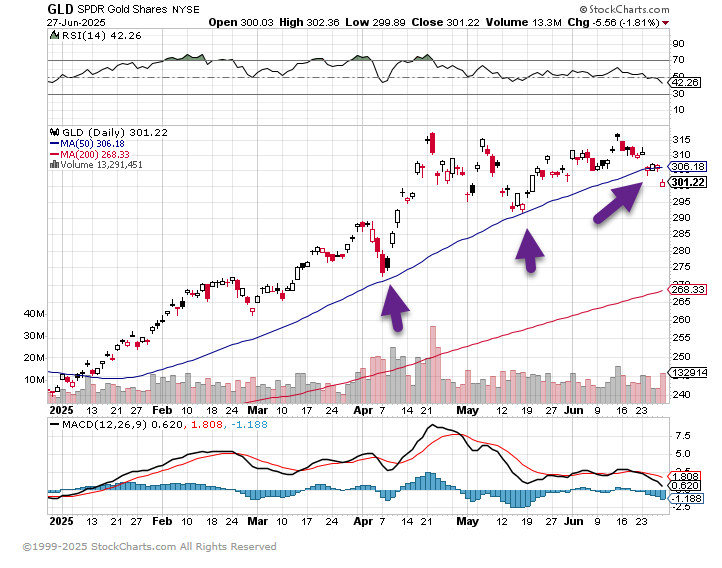
5. Gold ETF Closed Below 50-Day Moving Average After Holding in April and May
StockCharts
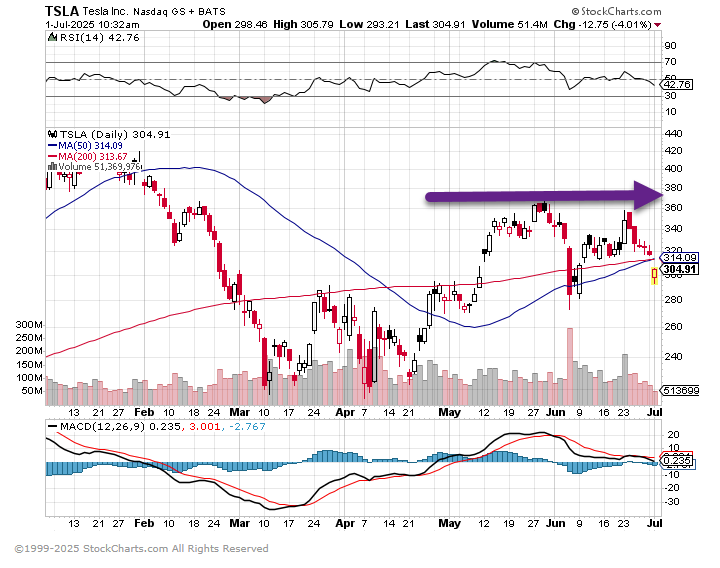
6. Tesla Failed at Previous May Highs
StockCharts
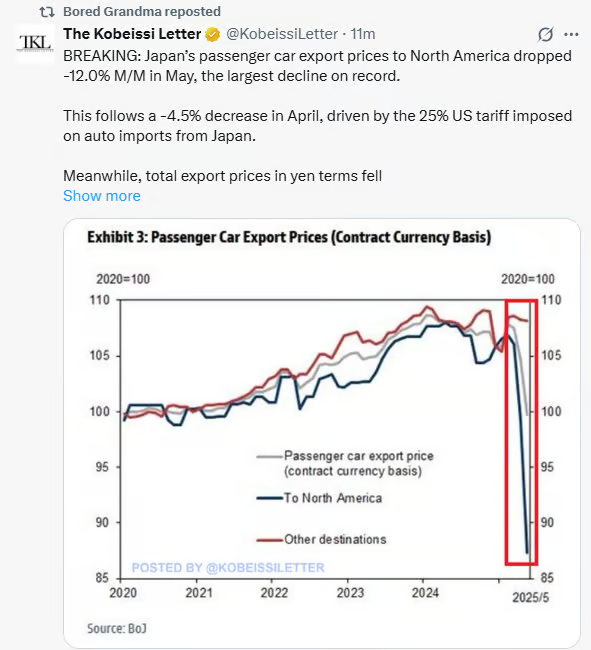
7. Japan’s Passenger Car Exports to North America Drop Largest on Record
The Koeissie Letter
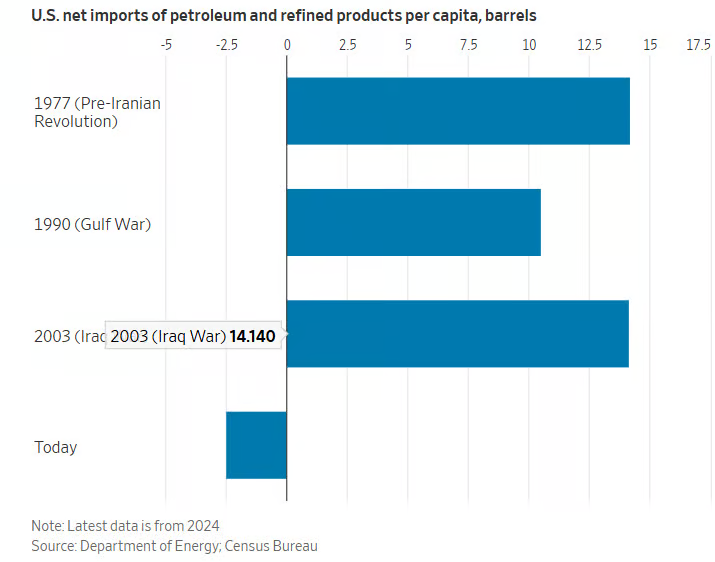
8. U.S. Net Exporter of Oil vs. Historical Middle East Wars
WSJ
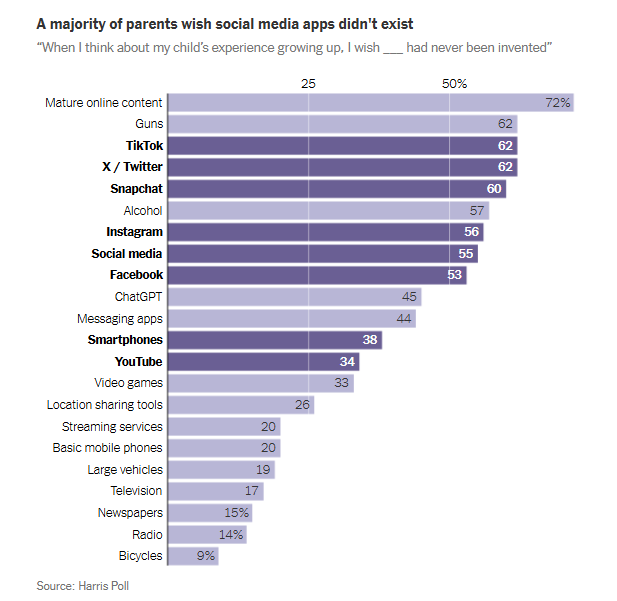
9. Parents Opinion on Social Media Apps
WSJ
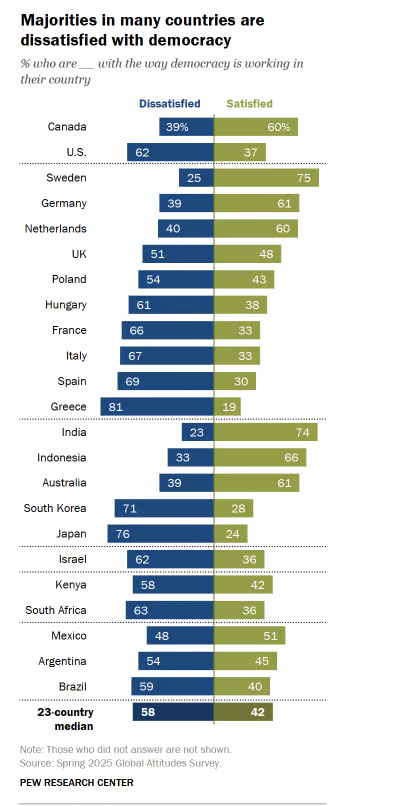
10. Countries Satisfied vs. Dissatisfied with Democracy-Pew Research
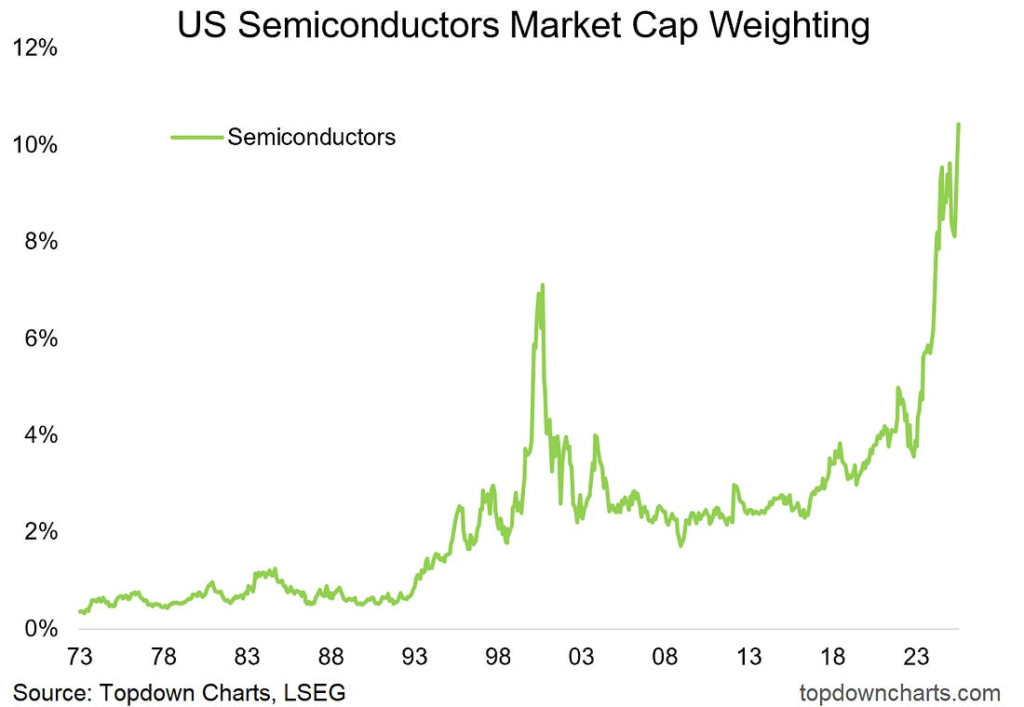
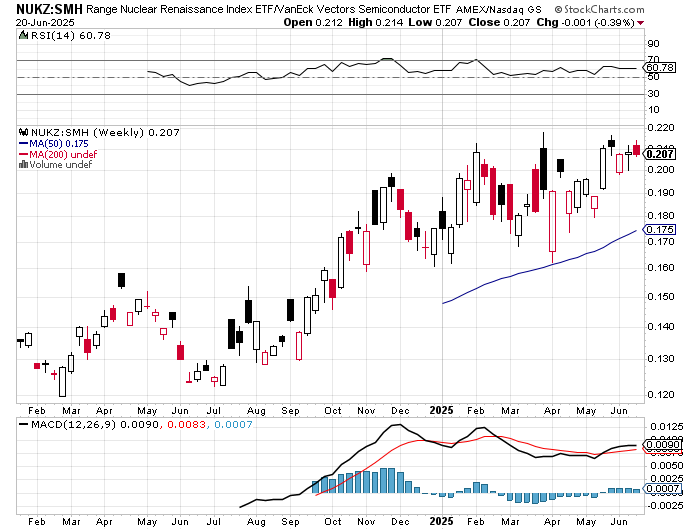
Semi Surge: After a period of consolidation around the previous all-time highs, US semiconductor stocks’ market cap weighting has surged onto fresh record highs (looking rather like a bull flag!). So, who knows, maybe we’re still early in the hype cycle? (and maybe that was all just a healthy correction/consolidation…)
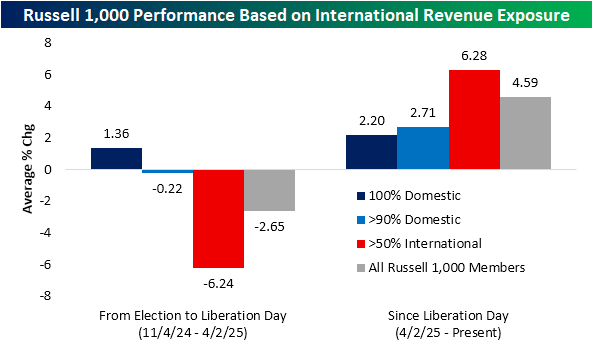
Equities have returned to record highs, but performance during the fall from grace earlier this year and the subsequent rebound off the April lows has not exactly been even. With tariff headlines being one of the main focuses of the market this year, performance has been sensitive to how exposed a given stock is to international trade. One proxy for this international exposure is the percentage of revenues that a company generates inside versus outside of the US. As shown below, from the election last November through Liberation Day when President Trump first announced reciprocal tariff rates, the best-performing cohort of Russell 1,000 members was those that do not generate any revenues outside of US borders (about 27% of member stocks in the index). That group averaged a 1.36% gain over that span compared to an average loss of 6.24% for the stocks that generate over half of their revenues outside the US (a little less than 20% of member stocks) or a more modest 2.65% average loss for all stocks in the index. Obviously, with the index trading at fresh records, stocks have amazingly been in rally mode in the wake of Liberation Day, with the average Russell 1,000 now sitting on a 4.6% gain in that span. Those internationals that had formerly been hit the hardest have since shifted to the best performers, averaging a 6.28% gain.
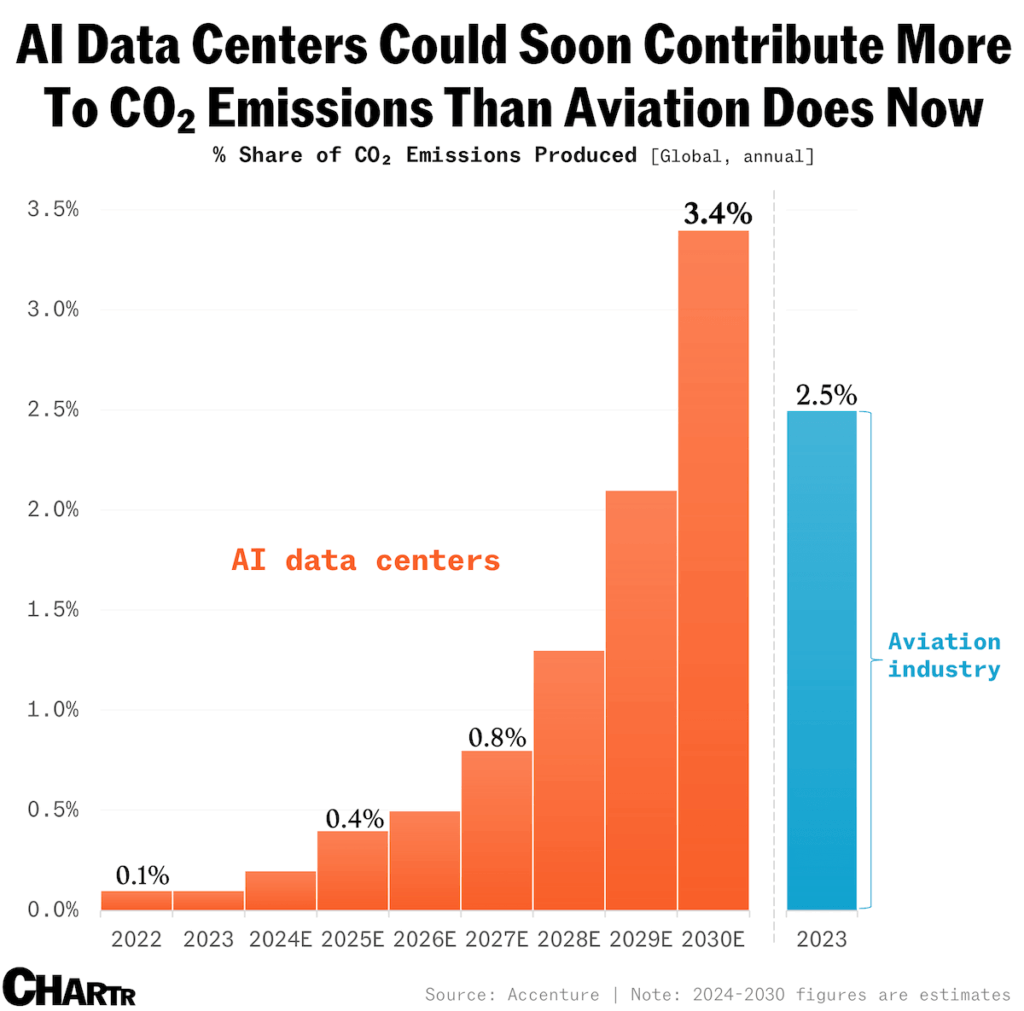
That’s a considerably greater share of total emissions than the entireaviation industry— a sector often admonished for its carbon footprint — notched at the last count, when the flying business took 2.5% of global CO2 emissions. It would also exceed the emissions contributed by both Germany (1.75%) and Saudi Arabia (1.58%) combined in 2022, per estimates from the IEA.
10. Education is Free Learning is Expensive-Seth’s Blog
That’s a complete reversal of how it used to be.
Colleges used to be measured by how many books they had in the library. Access to courses was restricted. If knowledge was power, controlling access was essential.
They even call it the ‘admissions office.’
Part of the status that comes from higher education is that they controlled who could find the information and who was left behind.
Today, of course, all of the information is there, a click away. Billions of people have a smartphone with access to everything ever recorded and written, but also to a trillion dollar AI system that can offer informed guidance.
So why hesitate? Why do we get stuck or avoid even acknowledging that it’s possible?
Because learning is hard. It creates tension. It takes time. Most of all, it requires a commitment to becoming someone else, a bet we’re making that might not turn out the way we hope.
The system has called our bluff. If you want to learn, learn.
4. This Chart Shows Nuclear Energy ETF (NUKZ) vs. Semiconductor ETF (SMH)…Nuclear Outperforming
StockCharts
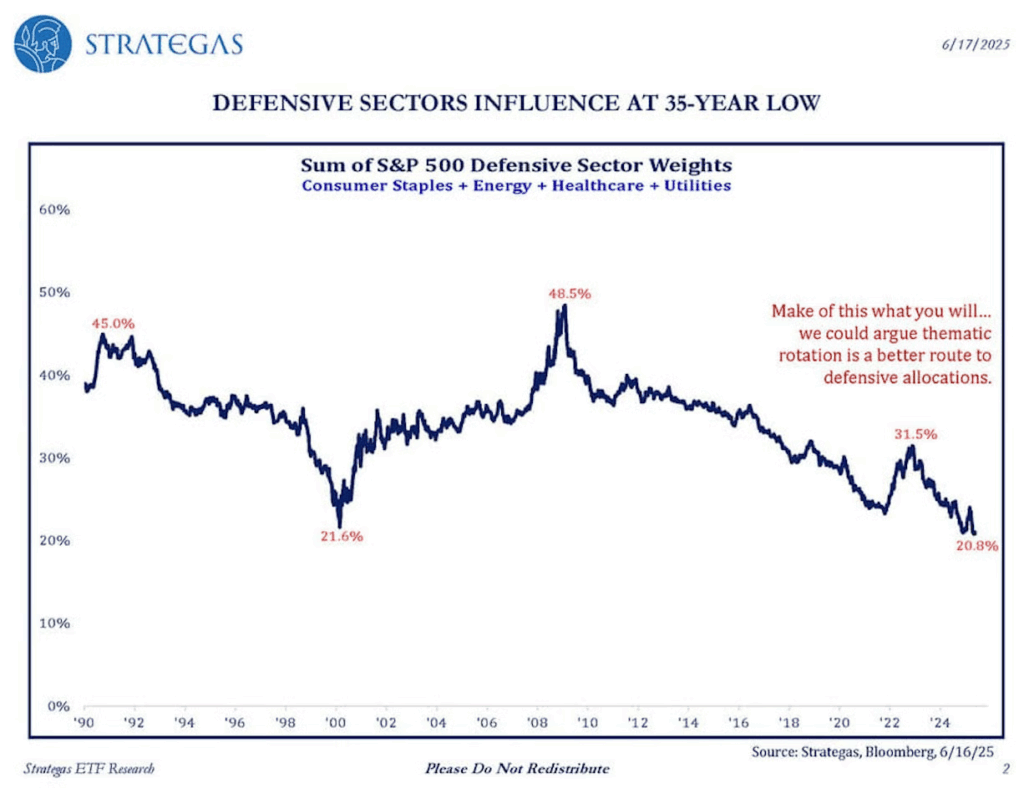
5. Defensive Sectors at 35 Year Low Weight in S&P 500
Defensives vs. SPX. As a share of the S&P 500, the combined weight of Defensive sectors is at a +35-year low.
Daily Chartbook
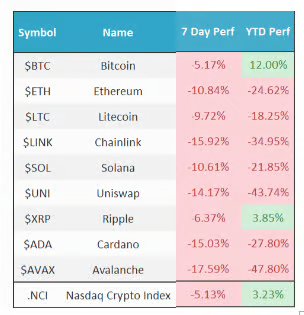
6. Crypto Year-to-Date
Nasdaq Dorsey Wright
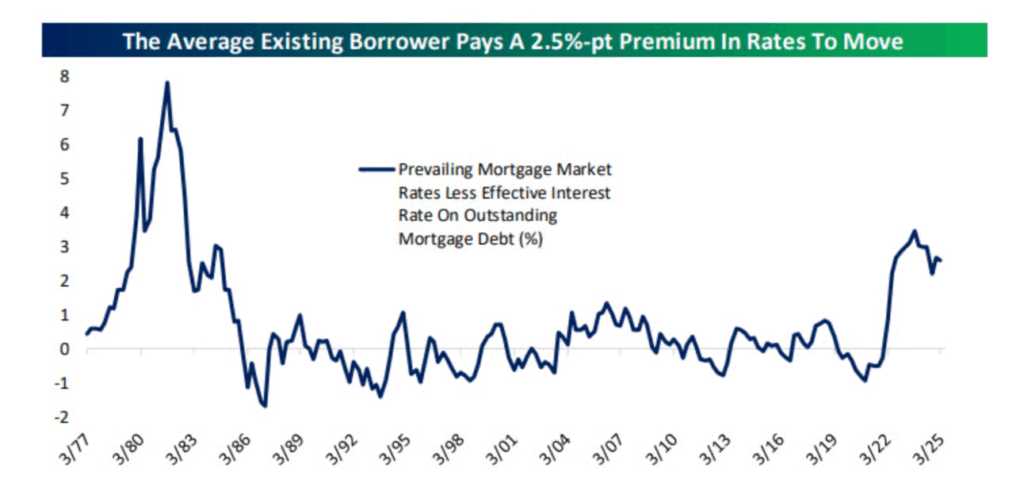
7. The Average Home Owner Pays 2.5% Premium in Rates to Move Right Now
Bespoke
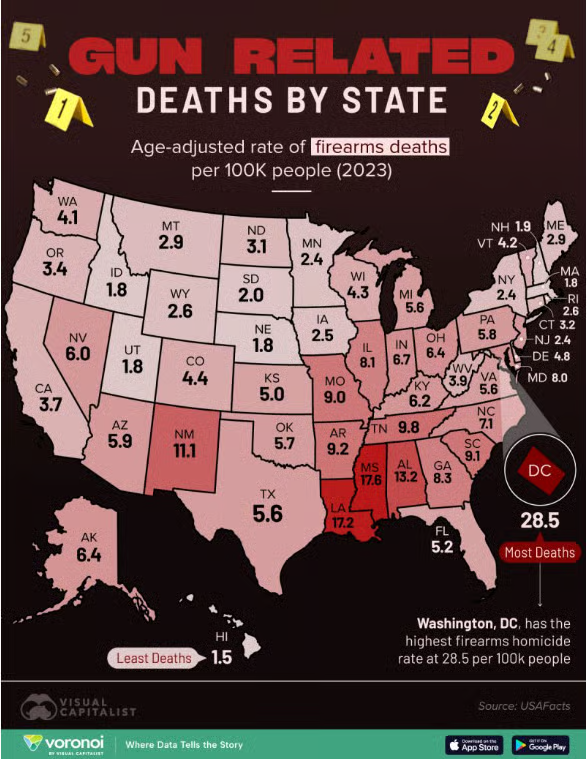
8. Gun Related by State
Visual Capitalist
9. The Greatest Stock Pickers of All-Time-Warren Buffett, Jim Simons and NANCY PELOSI. Pelosi +54% 2024 Crushing All Global Hedge Funds…Huge Start to 2025
NY POST-Pelosi raked in millions last year — and her portfolio out-performed every large hedge fund with stunning returns.
She might be the She-Wolf of Wall Street.
Rep. Nancy Pelosi (D-California) raked in between $7.8 and $42.5 million in 2024 — meaning her estimated net worth with venture capitalist hubby Paul Pelosi could now top out at $413 million, new financial disclosures showed.
The staggering sum is an eye-popping jump from 2023, when financial disclosures showed the couple’s net worth topping out at a possible $370 million. The Pelosi’s added between $7.8 and $42.5 million to their net worth in 2024. Pelosi’s exact net worth is not known because lawmakers are only required to disclose ranges.
Market research firm Quiver Quantitative, which estimates a single figure based on daily stock values it tracks, placed the pair’s 2024 worth at $257 million — up $26 million from a year earlier.
But the value of their various other ventures — which include but are not limited to a Napa Valley winery, ownership in a political data and consulting firm and a stake in a Bay area Italian restaurant — mean Pelosi’s worth could be far higher in the estimated range.
A large chunk of the couple’s fortune has come from a sizable stock portfolio and timely trades, all done in Paul Pelosi’s name.
The former House Speaker, who’s so infamous for trading Missouri Rep. Josh Hawley named a bill after her, and her husband dumped 5,000 shares of Microsoft stock worth an estimated $2.2 million in July — one of their largest sales in three years — a few short months before the FTC announced an antitrust investigation into the tech giant.
They also sold 2,000 shares — worth an estimated $525,000 — of Visa stock, less than three months before the credit card company was hit with a DOJ monopoly lawsuit.
Some have nicknamed Pelosi the “Queen of Stocks.” Getty Images for The Museum of Contemporary Art (MOCA)
Their best trade though might have been exercising a call option in December they bought in late 2023 at an estimated premium of $1.8 million, allowing them to nab 50,000 shares of hot AI chip stock NVIDIA for $12 a pop — less than one tenth of its market price.
In total the couple paid an estimated $2.4 million for the investment, which on paper is now worth more than $7.2 million.
NVIDIA wasn’t their only AI play of 2024.
The couple also paid between $600,000 and $1.25 million for a call option on California cybersecurity company Palo Alto Networks in February, the same week it was revealed the White House briefed lawmakers on a serious national security threat related to Russia.
The shares rose close to 20% in the days after the move.
A bill aiming to ban lawmakers and their spouses from trading individual stocks was named “The PELOSI Act.” Jack Forbes / NY Post Design
The option allowed the pair to scoop up 14,000 shares of Palo Alto in December at a $100 strike price — half its trading value. The company has been crushing earnings over the past year and the investment is now worth around $2.8 million.
But the Queen of Stocks did suffer one setback — when she and Paul Pelosi ditched 2,500 shares of former Department of Government Efficiency boss Elon Musk’s Tesla in June, losing somewhere between $100,000 and $1 million on the trade.
In all, their investment portfolio pulled in an estimated 54% return in 2024, more than double the S&P 500’s 25% gain — and beating every large hedge fund, according to numbers in Bloomberg’s end-of-year tally of hedge funds’ returns.
The couple is already off to a rocking 2025.
In January, they bought call options for then-little-known artificial intelligence health firm, Tempus AI, which has since inked a $200 million deal with AstraZeneca and doubled its stock price.
Pelosi and her good fortune have been at the center of arguments about why Congress shouldn’t be allowed to trade stocks. Ron Sachs – CNP for NY Post
The formidable profits come amid growing calls to ban Congress from trading individual stocks, arguing lawmakers have access to market-moving information ahead of the public.
Pelosi in the past rejected calls for a ban, stating “we’re a free‑market economy.”
She has since softened her stance in the face of growing criticism. When asked in May whether Congress should pass a trading ban, she replied, “If they do, they do.”
“Speaker Pelosi does not own any stocks, and she has no prior knowledge or subsequent involvement in any transactions,” a spokesperson told The Post.
The couple also took out call options for energy company Vistra — whose stock climbed last month after it unveiled a massive $1.9 billion deal to acquire natural gas facilities across the country from a private equity firm, citing rising US power demand.
10. Invest in Your Human Capital for a Good Life
Psychology Today: What economics can teach us about happiness. Insights from economic concepts.
In her search for a more balanced and fulfilling life, van Horen found unexpected wisdom in economic concepts.
Constrained optimization refers to the idea of maximizing satisfaction within our given limits, explains van Horen. In economics, it’s about getting the best possible outcome given constraints like time, money, or other resources. In life, it means making the most of your energy, attention, and circumstances—not by doing more, but by choosing wisely.
Too often, we chase a single goal in isolation. For example, we might pursue career success or financial security, without accounting for what we might have to sacrifice elsewhere, including our health, relationships, or peace of mind. Constrained optimisation invites a shift. Instead of asking, “How can I achieve the most in this area?” it asks, “How can I find the best balance across everything that truly matters to me?”
Opportunity cost is the understanding that every decision comes with a trade-off. Saying yes to one thing means saying no to something else.
“Every action has a cost, even if it’s not always obvious,” says van Horen. “Often, we ignore the cost and focus only on the benefit.”
For example, if you agree to take on a task—perhaps to avoid disappointing others—the opportunity cost might be the time you won’t spend working on something meaningful to you. Placing our options side by side and consciously considering the opportunity cost can help us make more informed decisions. Ask yourself: What am I gaining? What am I giving up in the process? The key, according to van Horen, is awareness: realizing that doing one thing always comes at the expense of something else.
The law of diminishing marginal returns tells us that as you increase the amount of input or effort, the additional benefits or output will gradually decrease. In fact, beyond a certain point, additional effort can backfire, yielding even negative results.
In our striving and overachieving cultures, where perfectionism is pervasive and productivity is often fueled by pushing ourselves harder, slowing down can feel like a radical act.
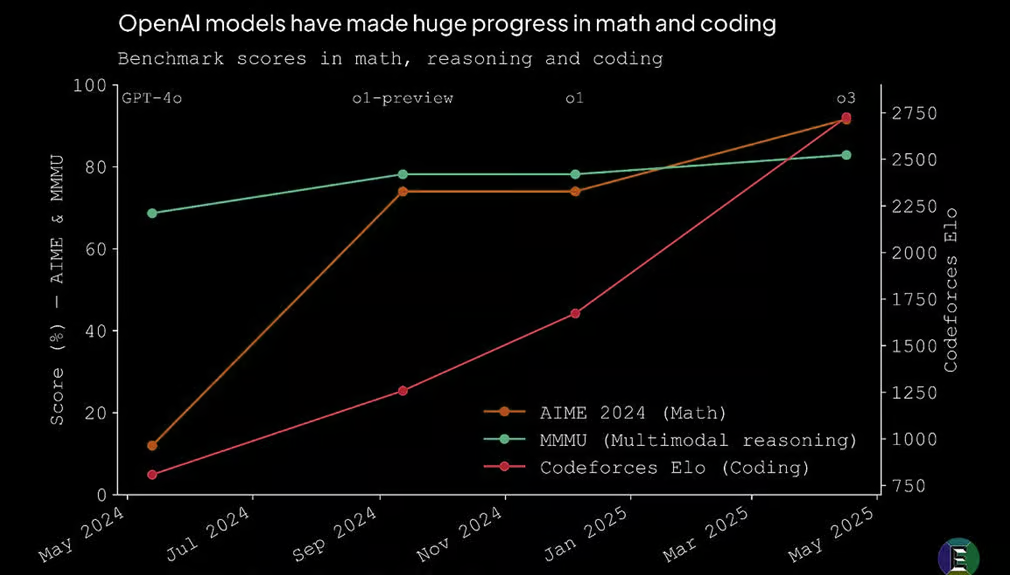
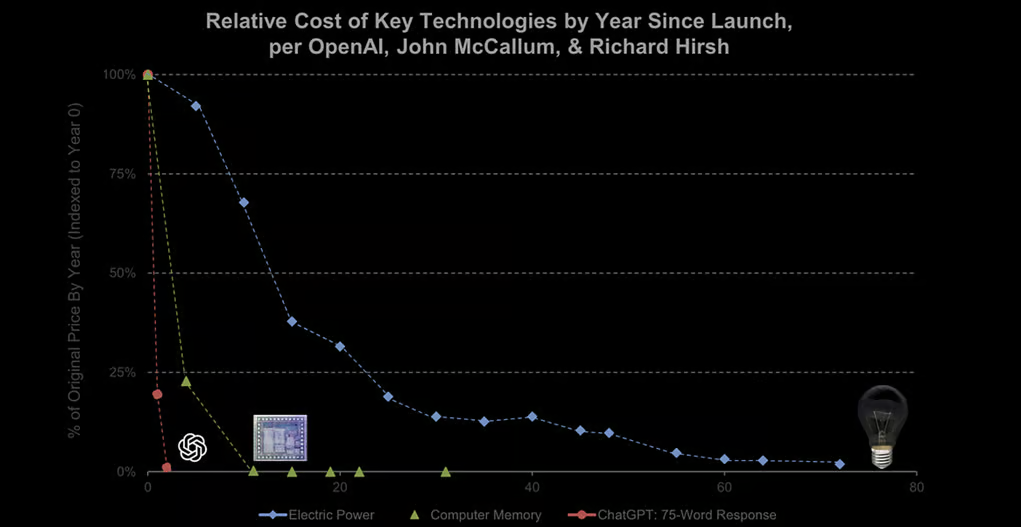
Nearly every public benchmark has moved upward since last year, making previous standards of excellence look decidedly ordinary
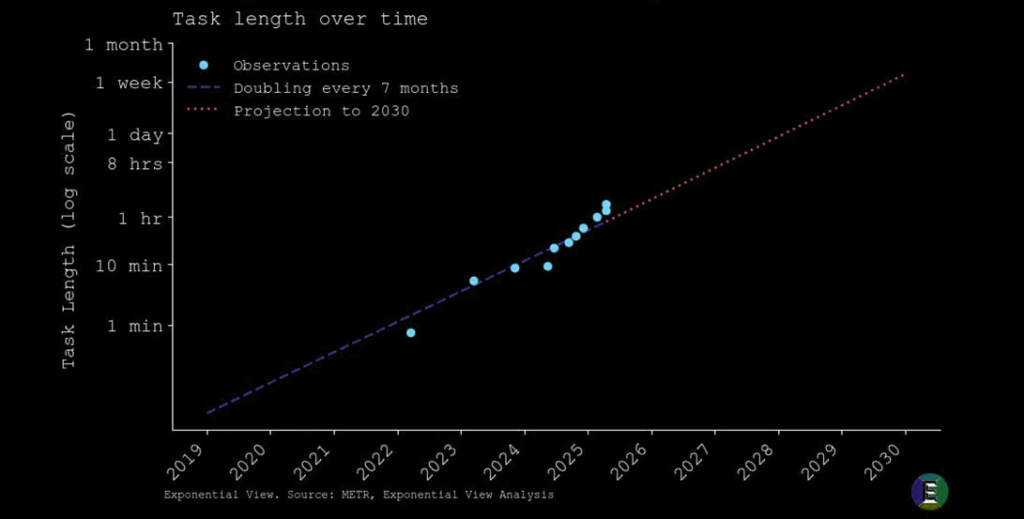
The length of tasks AI can do is increasing.
Perhaps even more crucially, the unit costs of AI are plunging exponentially. Azeem Azhar: “This is central to my definition of exponential technology—not solely about improving performance but about rapidly collapsing costs for a given capability.”
Zach Goldberg Jefferies
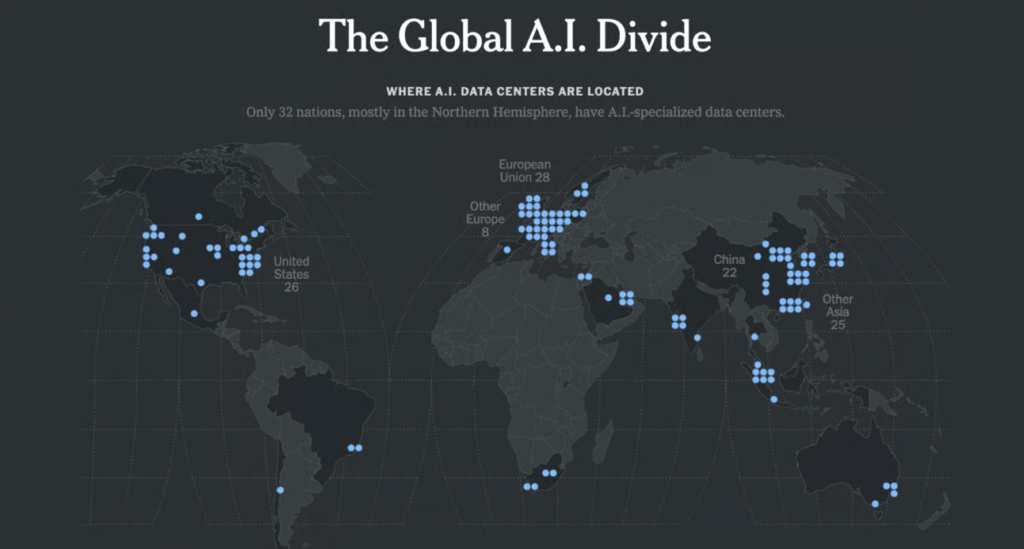
2. 195 Countries in World Today….32 Have an AI Data Center
NYT
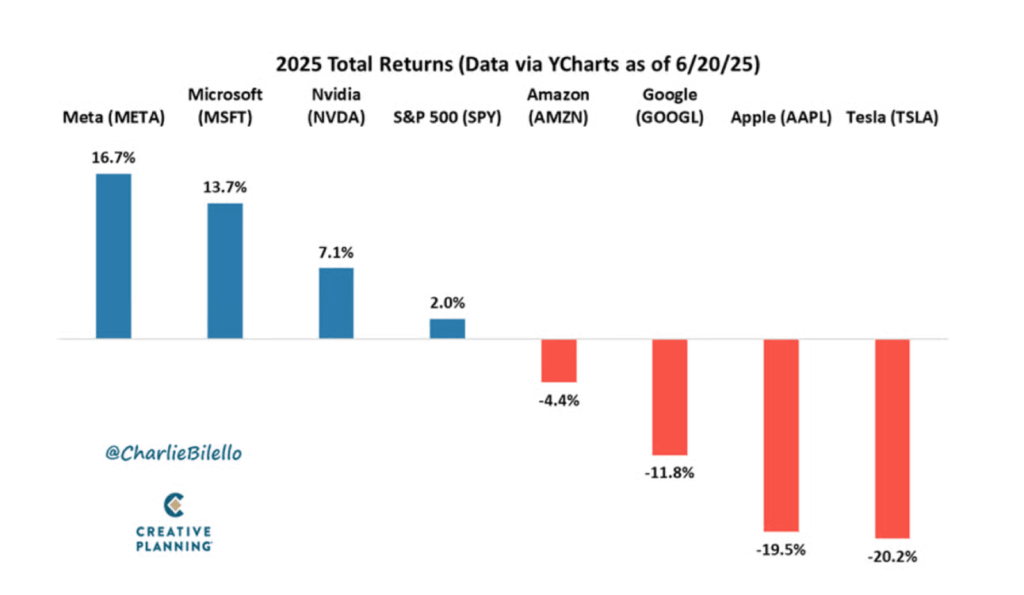
3. MAG 7 Returns 2025
Charlie Bilello
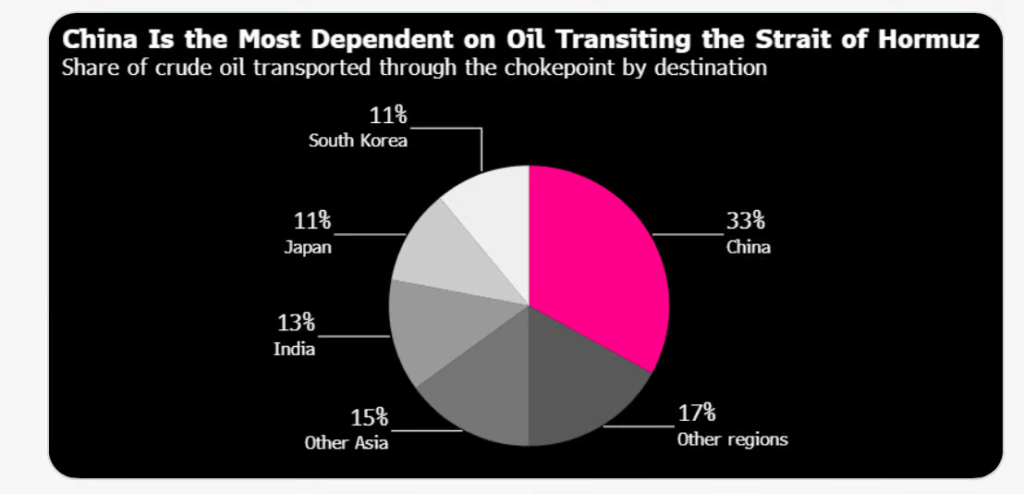
4. Strait of Hormuz Oil Destinations
Social Site News
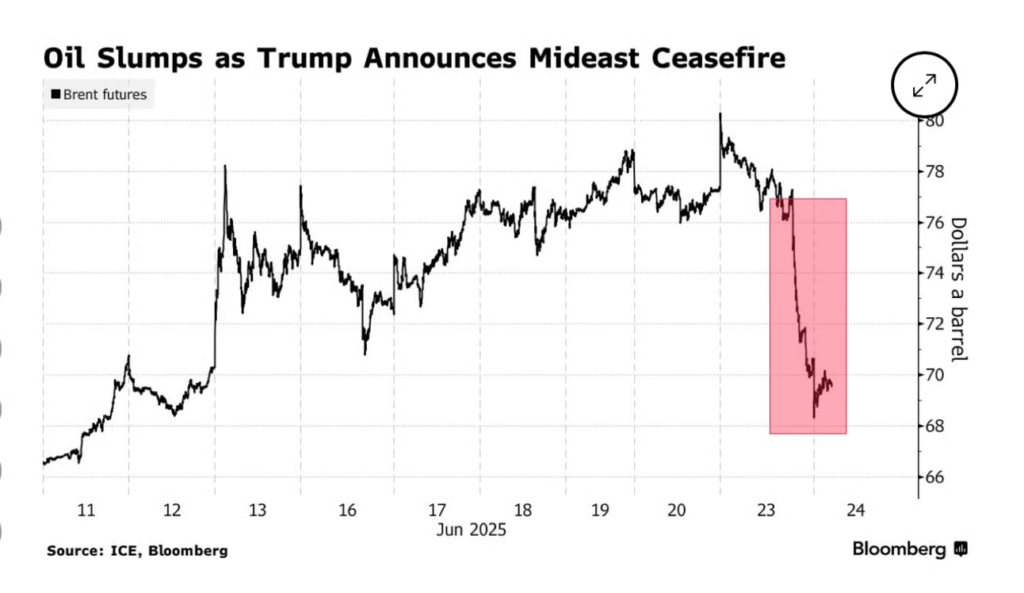
5. Israel and U.S. Bomb Iran—Oil Collapses
Daily Chartbook
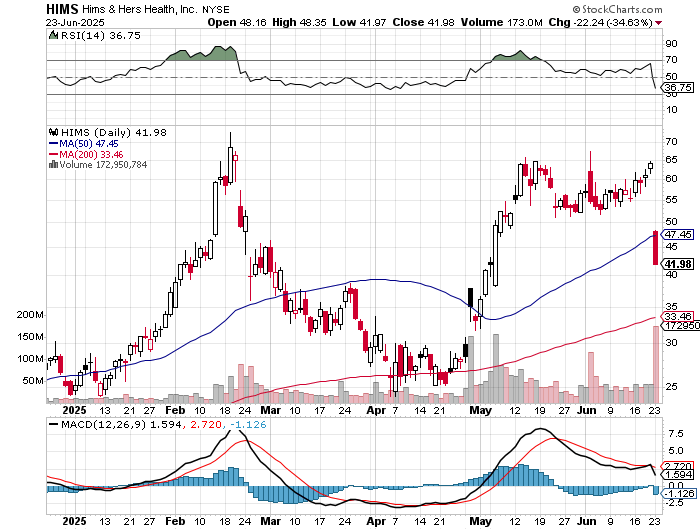
6. HIMS -35% in One Day…Still Not Back to May Lows….Still +66% Year to Date
StockCharts
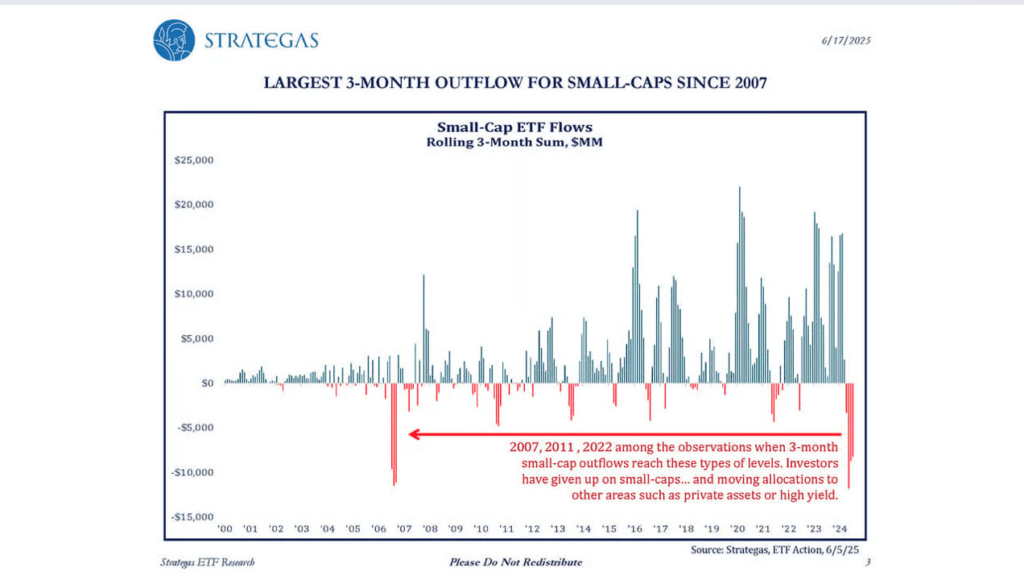
7. Largest 3-Month Outflows from Small Cap Stocks Since 2007
The Irrelevant Investor
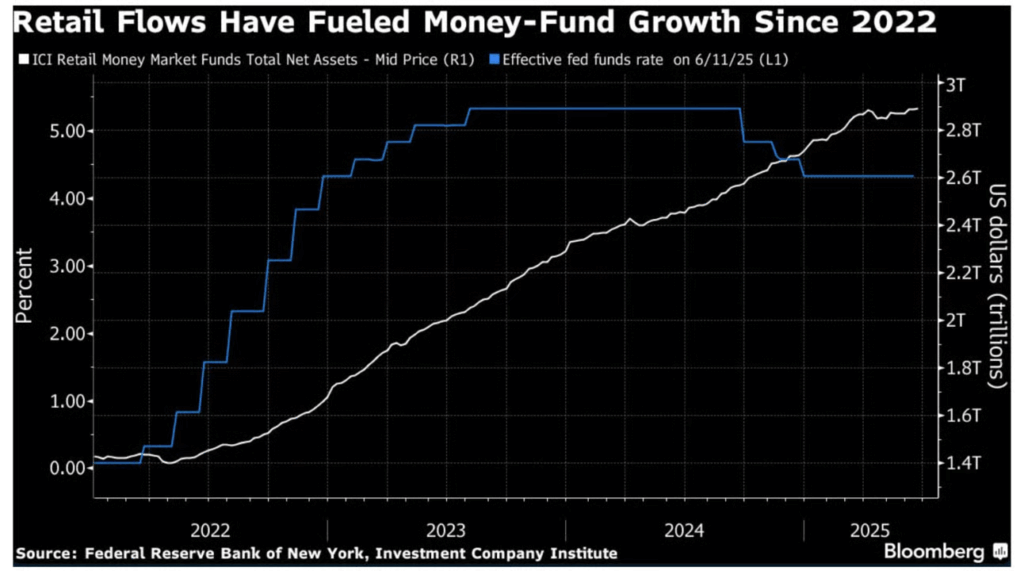
8. $320B Flows into Money Market Funds 2025
Bloomberg-Households have been a key driver of the inflows. Since the Fed started raising rates in March 2022, total assets under management in US money funds have swelled by roughly $2.5 trillion, and retail investors have accounted for about 60% of that, Investment Company Institute data show. Data from ICI exclude firms’ own internal money funds, unlike Crane Data, which tracks the money market industry.