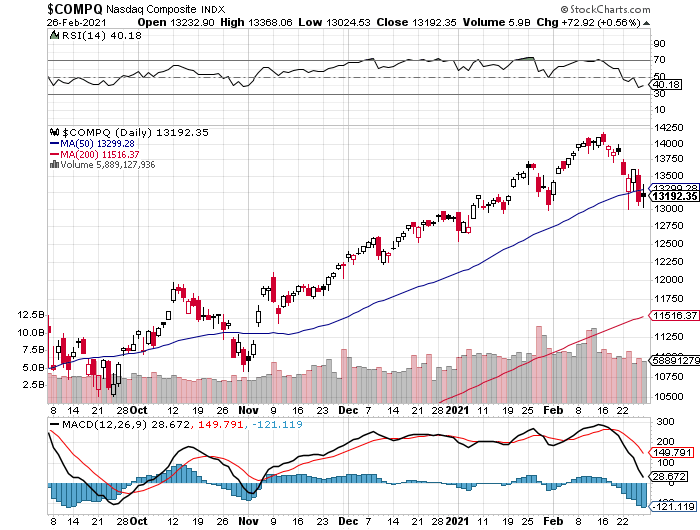
Topley’s Top 10 – March 1, 2021 March 1, 2021 Matt TopleyDaily Top Ten No Comments 1. Nasdaq Closes Below 50 Day First Time Since November. Nasdaq Comp closes below blue 50 day line Continue reading →
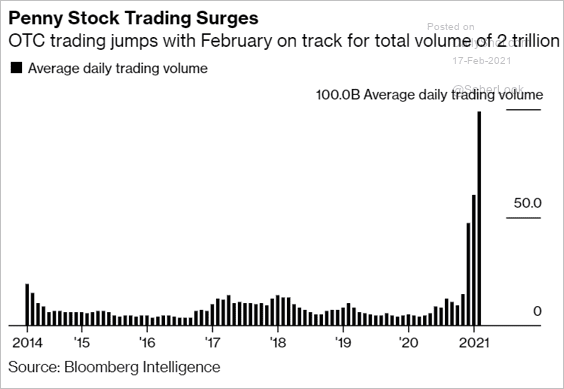
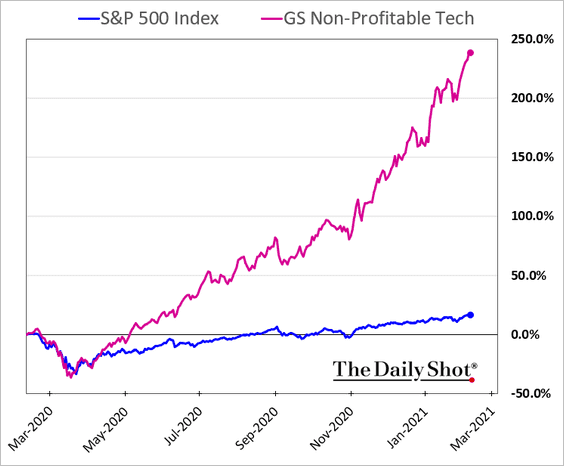
Topley’s Top 10 – February 25, 2021 February 25, 2021 Matt TopleyDaily Top Ten No Comments 1. Two Charts Summarizing Speculation in Markets Continue reading →
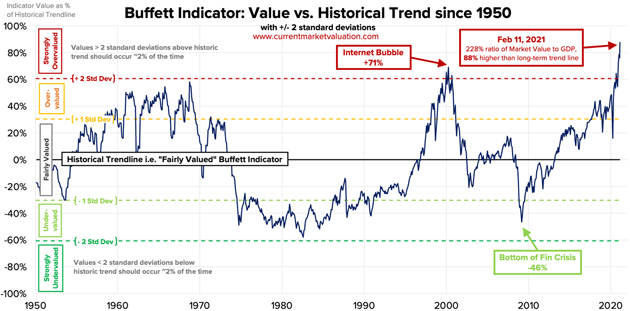
Topley’s Top 10 – February 24, 2020 February 23, 2021 Matt TopleyDaily Top Ten No Comments 1. Update Buffett Indicator and Buffett Indicator with Record Low Rates Continue reading →
Topley’s Top 10 – February 23, 2021 February 22, 2021 Matt TopleyDaily Top Ten No Comments 1. 2021 Big Sector Dispersion Already… Continue reading →
Topley’s Top 10 – February 22, 2021 February 21, 2021 Matt TopleyDaily Top Ten No Comments 1. Inflation–5 Year TIPS/Treasury Breakeven Rate About to Break-Out to 10 Year Highs Continue reading →