1. Big Tech Capital Spending
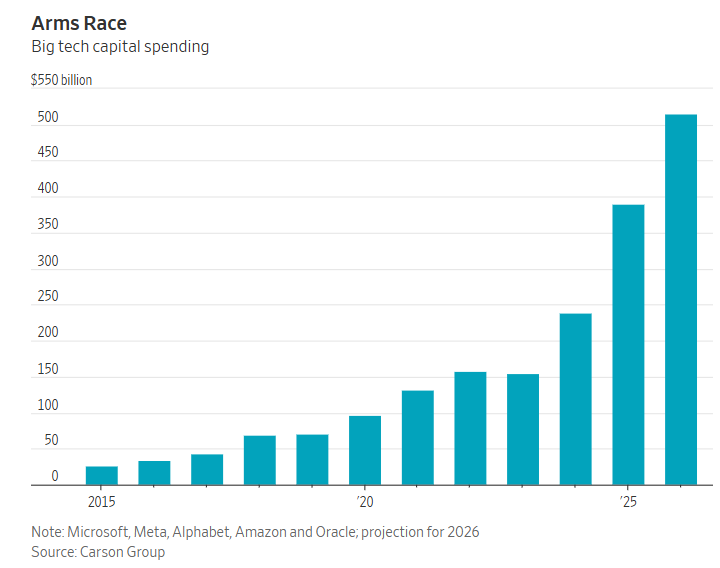
WSJ
2. Finra Margin as % of Russell 3000
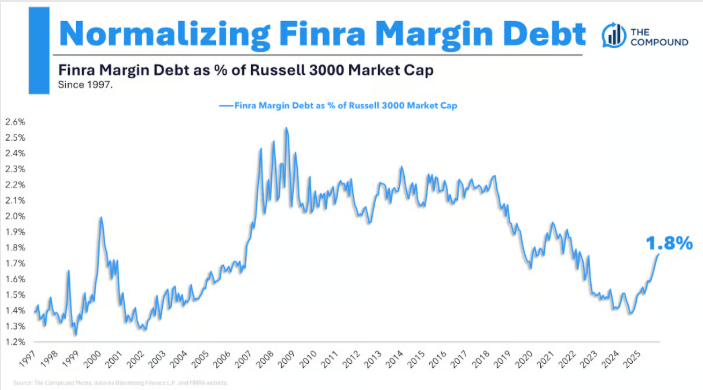
The Irrelevant Investor
3. One-Year Chart-Semiconductors +74% (SMH) vs. Software -7.5% (IGV)
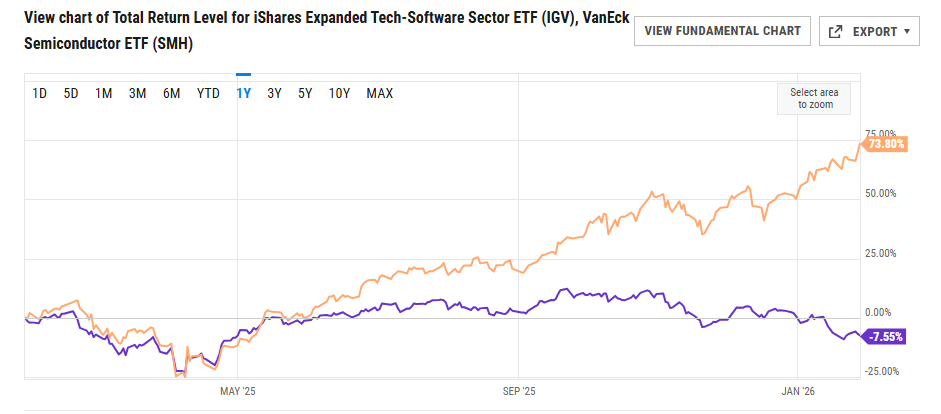
YCharts
4. Software Scorecard 2026
Here’s the Software scoreboard right now sorted by today’s σ move:
| Ticker | Today % | Today’s Stdev Move | YTD % |
| SAP | -16% | 7.6 | -18% |
| MSFT | -11% | 7.5 | -11% |
| WDAY | -11% | 4.6 | -21% |
| NOW | -11% | 4.4 | -25% |
| TEAM | -12% | 3.4 | -26% |
| INTU | -7% | 3.4 | -25% |
| ADSK | -6% | 3.4 | -15% |
| HUBS | -11% | 3.3 | -30% |
| CRM | -7% | 3.3 | -20% |
| DT | -7% | 3.2 | -13% |
| BL | -7% | 3.0 | -13% |
| FRSH | -8% | 2.8 | -14% |
| ZS | -7% | 2.7 | -12% |
| DDOG | -8% | 2.6 | -4% |
| CRWD | -8% | 2.6 | -7% |
| SNOW | -8% | 2.5 | -9% |
| GWRE | -6% | 2.5 | -24% |
| KVYO | -10% | 2.4 | -28% |
| PEGA | -8% | 2.4 | -24% |
| DOCU | -8% | 2.4 | -23% |
| NTNX | -7% | 2.4 | -25% |
Dan Stratemeier Jefferies.
5. Gold vs. Silver Mint Ratio
Dorsey Wright Mint Ratio Calculation & Context
The Mint Ratio is calculated by dividing the price of one ounce of gold by the price of one ounce of silver. It expresses how many ounces of silver are required to purchase a single ounce of gold, making it a useful gauge of the relative valuation between the two metals. The importance of the ratio lies not in its absolute level, but in how it changes over time and what those changes suggest about broader market trends. Since gold is widely regarded as a safe-haven asset, a rising Mint Ratio typically indicates that gold is outperforming silver, signaling increased demand for safety. Conversely, silver’s substantial industrial demand is more closely related to an increase in economic growth. When the Mint Ratio declines, it indicates that silver is outperforming gold, reflecting improving growth expectations and thus greater appetite for risk.
The chart below illustrates the historical behavior of the Mint Ratio dating back to 1975. Over this period, the ratio has averaged a value of roughly 63.5, meaning that it has historically taken about 63.5 ounces of silver to purchase one ounce of gold. Between 2012-2025, the ratio has largely remained above its long-term average, indicating sustained relative strength in gold. Over the past year, however, this trend reversed sharply as silver began to outperform. The Mint Ratio peaked just above 100 in April of 2025 before entering a sustained downtrend. Notably, the ratio fell below its historical average in December, signaling a shift away from defensive positioning and toward a more offensive, risk-oriented market postures.
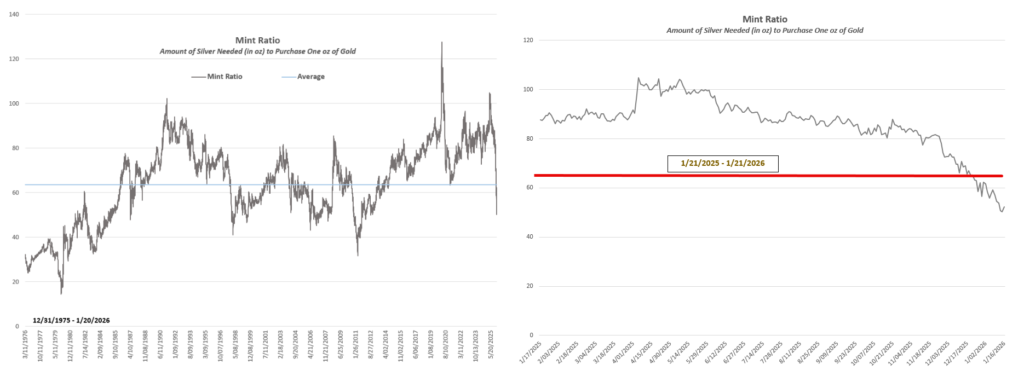
Nasdaq Dorsey Wright
6. Coinbase 50day thru 200day to Downside…Speculation Moves to Kalshi and Polymarkets?
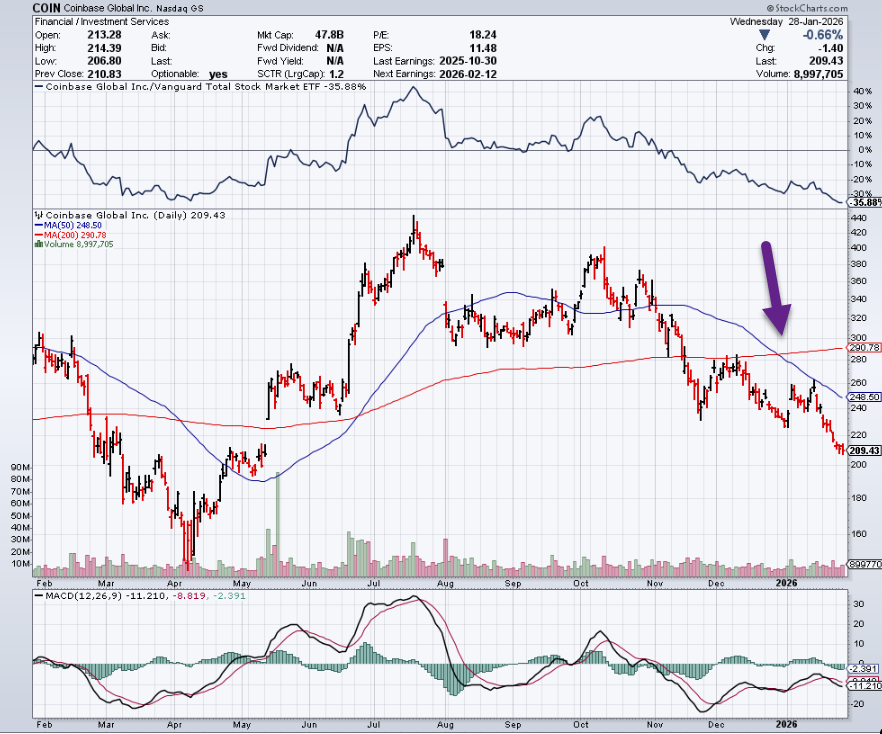
StockCharts
7. Small Cap Materials ETF Breakout
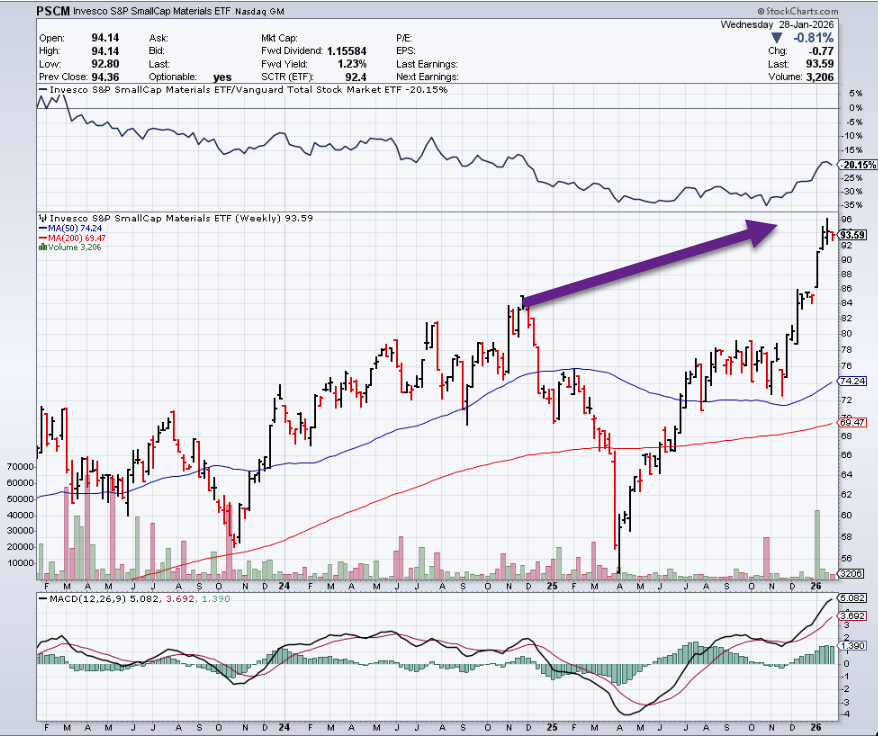
StockCharts
8. General Motors Chart Breakout…+75% One-Year
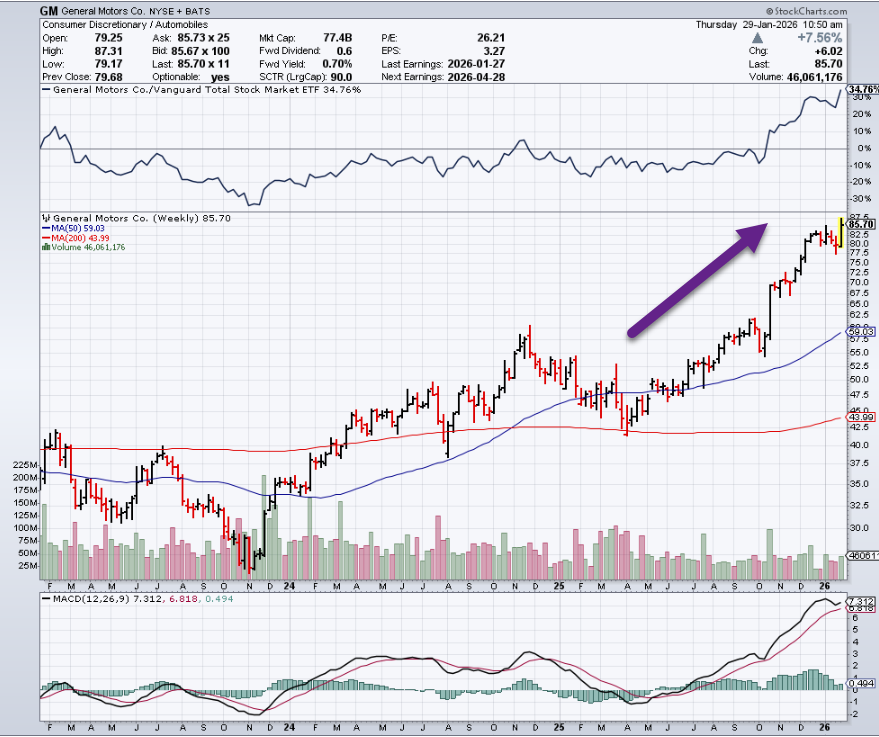
StockCharts
9. Boeing Ran Up to 2024 Highs then Reversed
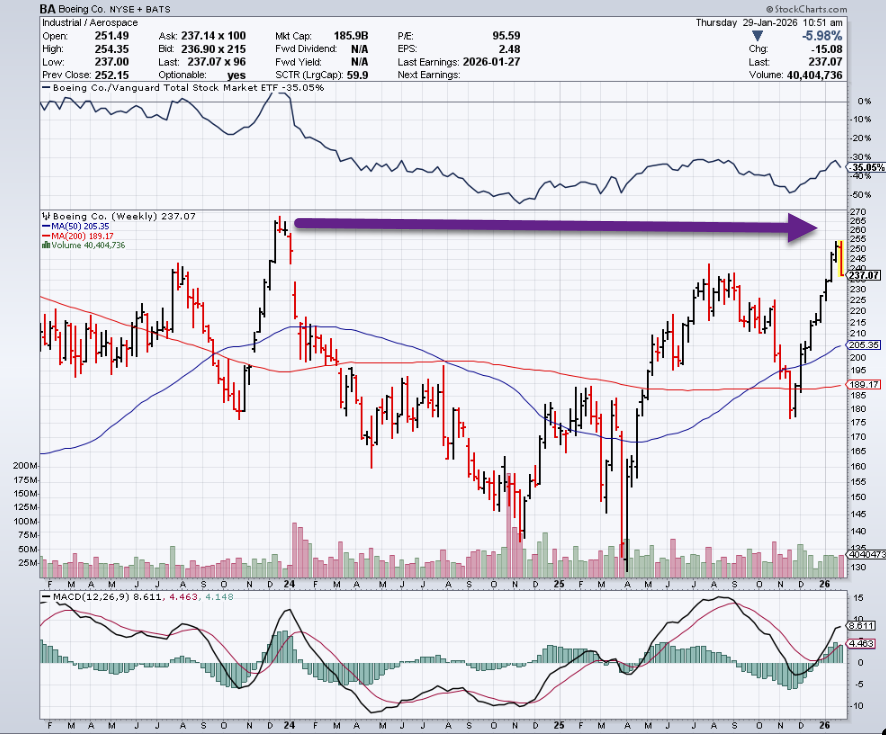
StockCharts
10. Terrible-Seth’s Blog
Most of us are terrible at some things.
Lack of skill, focus, practice, care or just temperament means that we don’t do the task as well as we might. This might be anything from promptness to conflict to high-stakes negotiation. It could include filling in forms, taking notes or brainstorming innovative ideas. Perhaps it’s living with uncertainty…
Once you realize your areas of terrible, choices arise:
- We can choose to put in the effort to become not-terrible.
- We can avoid the tasks, automate or delegate and simply avoid our terrible areas.
- When asked, we can announce we’re terrible, setting expectations so we don’t let folks down.
The one that’s probably worth avoiding is: Accepting tasks and making promises and then quietly doing a terrible job.