Although I enjoy reading market pundits predictions for each new year, it would seem to be overkill with me adding another list to the mix. So instead, the following is my inaugural Top 10 Reversion to the Mean Trades for the New Year. Yes I know its late but I didn’t think of it until a couple of weeks into the year. It’s very important to note that these are discussion points that require much more due diligence prior to allocating your hard earned money. Also these are trades, not long-term investments, so keep your stop/losses tight if you decide to pursue an idea. Here we go….
When the FED pivots, someone goes through the windshield. We are starting to see some serious stocks through the window action.
1.Everyone is long risk assets
2.Everyone long the same risk assets
3.Valuations at or above 1999 levels for almost all fundamental measures.
4.Leverage in the system is married to the FED’s interest rate policy
5.Going against the consensus is easy but going against consensus and winning is hard.
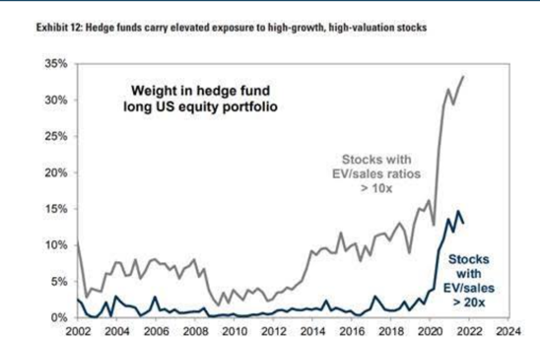
What we have witnessed in the first few weeks of 2022 is the start of a “huge hedge fund hotel” unraveling. Simply put, “hedge fund hotel” stocks occur when a large percentage of hedge funds park their money in the same group of names. The problem isn’t so much when they all enter at the same time but when they all have to exit at the same time. Most hedge funds are managing for quarterly or yearly numbers, not long-term returns. After the FED poured 8x the stimulus of 2008 into the markets, the hedge funds all bought the most expensive high growth names, sending the P/E valuation on growth stocks from 18x to 33x. But they even more aggressively purchased “disruptor stocks” meaning the most expensive names that hit 10-20x sales as you can see in the excellent chart below.
Now as the FED begins a rate hike cycle, hedge funds are shifting to value names with high cash flow and inflation protected margins. This unraveling does not happen without any pain so expect to see multiple dip rallies wiped out before new lows are made. I spoke to multiple young Millennials last week that have never seen a true valuation re-set (Covid was 30days) and they were dumbfounded that Netflix could go -20% and SHOP -15% in one day. Half of the Nasdaq stocks have already experienced -40% corrections but the tough part is they are still trading at high fundamental valuations.
However this letter is not a doomsday rant, it’s a reflection on the possibilities of new leadership, because as Warren Buffett says “there is always a bull market in something.” Instead of the usual 10 predictions for the New Year, I am going to start a Lansing Street tradition of 10 possible reversion to the mean trades each year. These are to spark conversation and encourage a much deeper research dive on your own part before choosing to invest your money. The good news is the world has plenty of assets that are fundamentally inexpensive versus history. I fully realize some of these suggestions have been cheap for some time but there is a chance that the no earnings growth stocks have given up leadership.
Hedge Funds go long disruptor stocks trading at 10x-20x sales when the FED took interest rates to generational low. Are they now exiting in unison? Where will the money go?
The Daily Shot Blog https://dailyshotbrief.com/the-daily-shot-brief-january-24th-2022/
First Annual 10 Reversion to the Mean Trades 2022
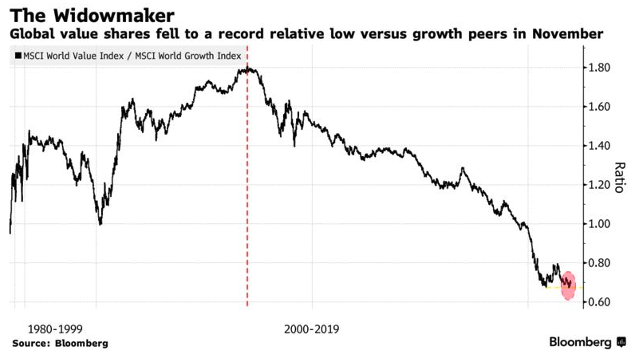
1. Global Value
The death of value stocks was how I started my career as a trader in 1997 when I entered a buy-side momentum shop that was fully participating in the internet bubble maniacal upside. At the same time I witnessed endless press and research about the death of value stocks forever. Institutional money was exiting value equities, as usual right at their decade bottom and well known value investors were closing their doors. And then boom the bubble burst and value made up five years of performance in 6 months. Friends, global value is currently trading at a significant discount, not just to growth stocks but much lower than the 1999 internet bubble bottom.
As GMO Research points out, emerging markets trounced the S&P coming out of 1999 bubble.

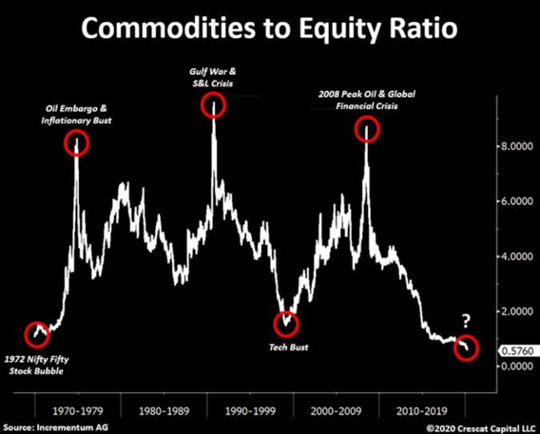
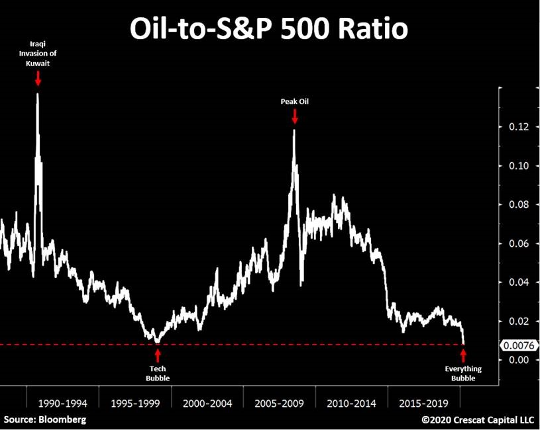
2. Commodities are Trading at a 50 Year Low Valuation Versus Stocks.
Caution for novice investors, commodities are always and forever a trading vehicle and not a long-term hold investment. Reversion to the mean in a commodities trade was set up before we started experiencing 7% inflation and mass labor shortages.
https://twitter.com/tavicosta/status/1245761018220826624
3. Commodities Low Correlation Cousins
Gold and Silver
I am definitely not a gold bug and anything around precious metals is a trade not an investment. The Bitcoin/Crypto as the new gold does not seem like it holds water as the crypto universe is trading along with high risk assets in this sell-off. You can deep dive yourself but it’s a bit of a myth that gold is a great hedge to inflation. What is true? Gold and silver have low correlation to stocks. Why is this especially important this time around? Because bonds are in a bigger bubble than stocks leaving the traditional 60/40 portfolio at huge risk. Nothing is guaranteed but it’s a trade worth exploring in an orgy of liquidity since gold/silver have low correlation to current risk assets. Proceed with caution and stop/losses. Gold and Silver average 0-.25 correlation to the S&P.
Silver still -44% from 2012 Highs…..0.12 Correlation to U.S. Stocks
When the gold/silver ratio is above 80, silver is comparatively inexpensive relative to gold. According to GoldSilver, the last three times the gold/silver ratio topped 80, silver increased 40 percent, 300 percent, and 400 percent.
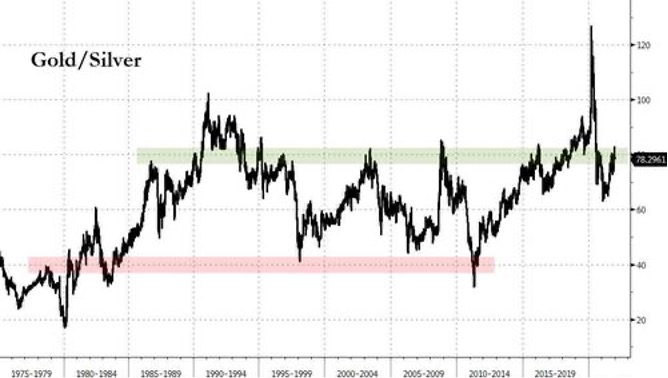
As of market close December 30, the gold/silver ratio is 78.78. That’s pretty doggone close to 80. Need we say more?
https://www.zerohedge.com/markets/how-survive-mega-collapse-2022
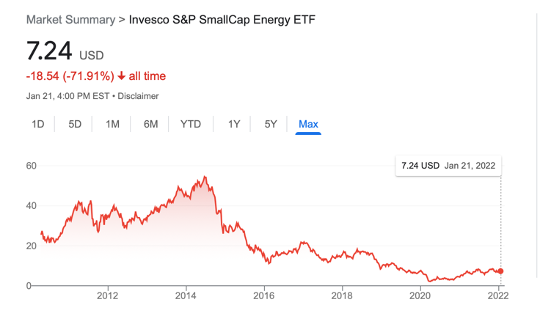
4. Commodities Small Cousin
Small Cap Energy ETF was at $50 in 2014 then hit $2 in the 2020 Covid melt down. As you can see on the chart it closed last week at $7.25. The solar, wind, and battery revolution is in the early innings but demand for traditional energy is not going away tomorrow. Energy stocks have sunk to a 4% market cap of the Russell 2000 small cap stock index.
Historical chart of PSCE energy ETF -72% from all-time highs.
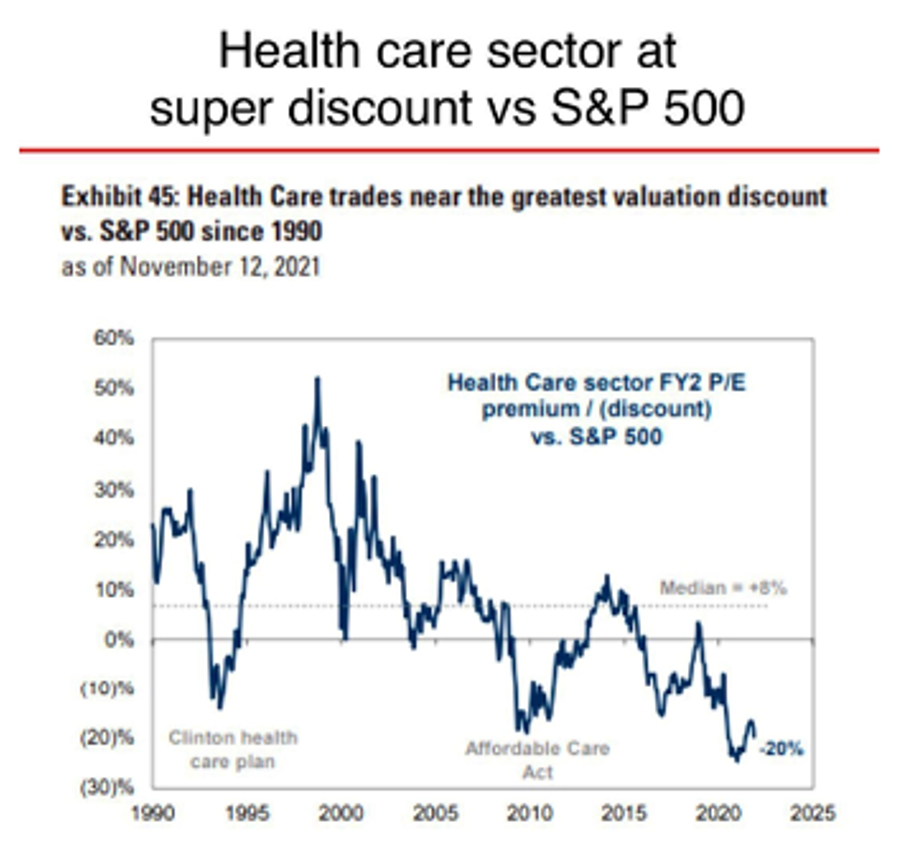
5. Big Pharma Stocks
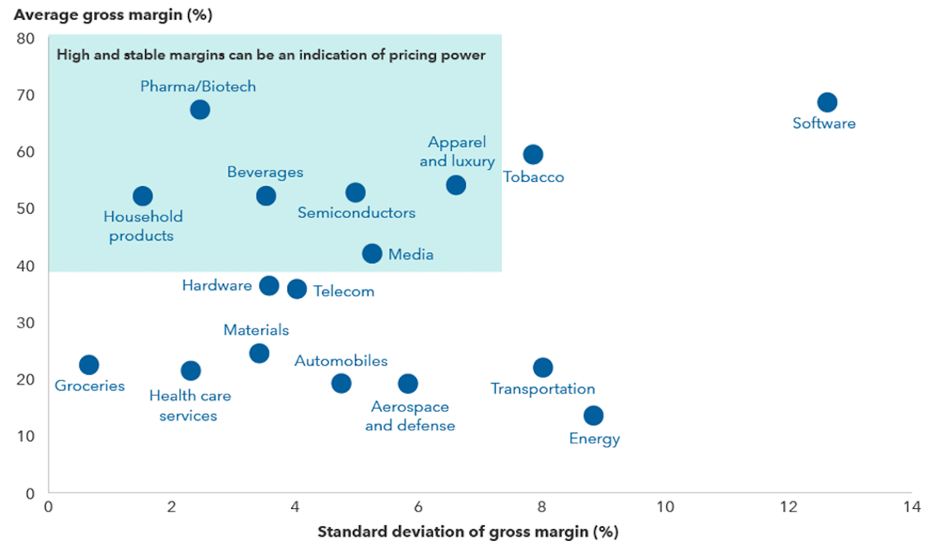
2021 saw healthcare stocks underperform the market for the third year in a row leaving the sector trading at its greatest valuation discount versus the S&P in 30 years. Some large cap pharma names have balance sheets that are more solid than all of the G-7 countries, pay healthy dividends and massive amounts of cash flow. Over a 5-10 year period…Do you want to own one of those companies or a bond that is almost guaranteed to lose money versus inflation? As a kicker, the second chart below points to healthcare having “high and stable” margins versus all other sectors, this is especially important during inflationary market conditions.
According to the below grid, the best sector for pricing power is healthcare.
6. Big Pharma’s Little Cousin Biotechnology
Biotech Stocks –The sector had a terrible 2021. The iShares Biotechnology exchange-traded fund (ticker: IBB), which weights its holdings by market capitalization, rose 1%, its worst year since 2018, while the equal-weighted SPDR S&P Biotech ETF (XBI) fell 25%, its worst year since at least 2007. This year was supposed to be better, but so far it’s been anything but, with the iShares ETF down 7.9% through Friday’s close and the SPDR ETF off 8%. For starters, biotech stocks almost never have two bad years in a row. The last time the SPDR ETF suffered a drop of 15% or more was in 2018, and the fund followed it up with a 33% increase in 2019. It dropped more than 15% in 2016 and followed that up with a 44% rise in 2017.
By Ben Levisohn-Barons https://www.barrons.com/articles/biotech-stocks-vertex-pharmaceuticals-pick-51641607296?mod=past_editions&tesla=y
As is usually the case @Charlie Bilello charts are much better than mine so see his summary of current biotech correction.
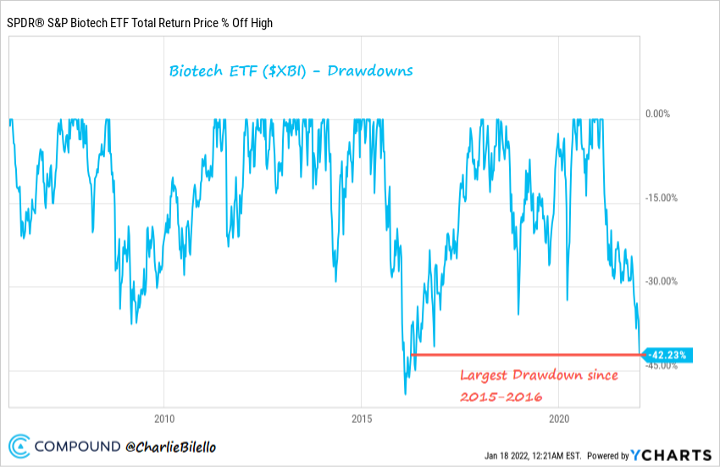
Biotech Bear-Rising interest rates and the prospect of Fed tightening continues to wreak havoc on high growth sectors.
Biotech stocks ($XBI ETF) are at the top of that list and are now over 42% from their high last February, their largest drawdown since 2015-16.
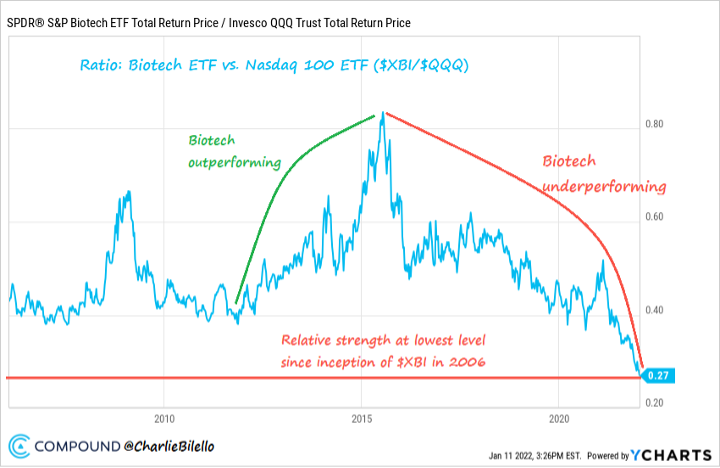
The relative weakness in Biotech stocks versus the Nasdaq 100 is notable…
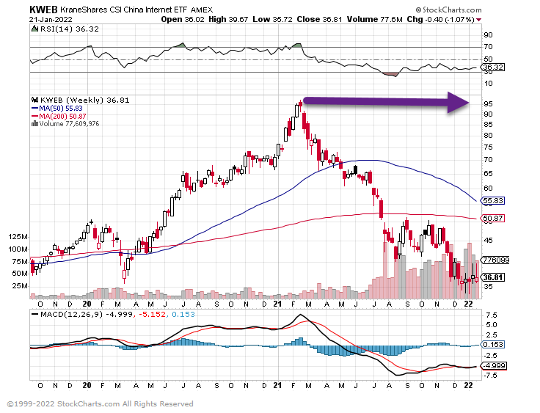
7. Chinese Internet
KWEB tracks overseas listed Chinese shares of internet companies. It’s a pure play on Chinese internet software and services. Yes China is becoming more Communist by the day but this ETF corrected -64% and the chart looks to be forming a bottom. According to the Nasdaq, KWEB experienced close to $250m of tax loss selling in the last weeks of 2021. In the 21st century, China can only disconnect from the world so much if they still want to keep 1.4 billion people happy. I only use this ETF as a visual so please do your own due diligence around de-listings but China ranks second behind U.S. for Unicorn private companies ($1B valuation). The tech sector is not going to zero under the Red Dragon’s more communist direction. Also keep in mind that the Chinese central bank is the only government bank that is lowering interest rates right now.
https://www.nasdaq.com/articles/noteworthy-etf-outflows%3A-kweb-0
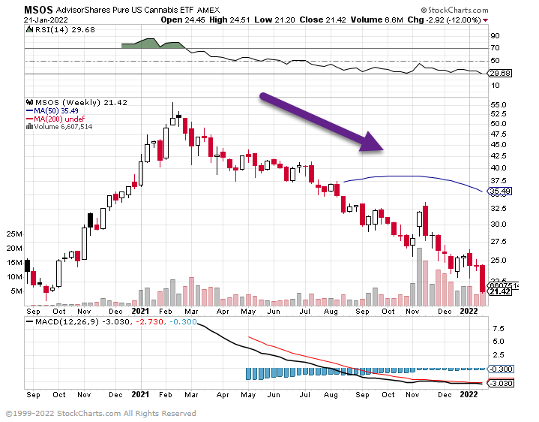
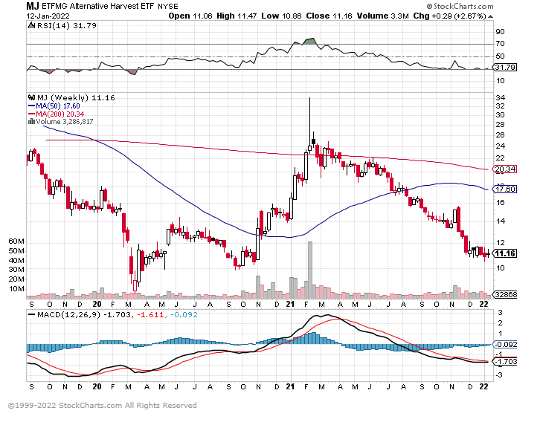
8. Weed Stocks
I don’t partake and I have never deep dived on the space but Weed ETFs are down 60-70% from highs. The macro factor in play is federal approval, especially since the first go round on compliance has left black market sellers at a distinct advantage versus legalized distributors. Once you let the monster out of the cage, it’s tough to reduce its impact. Public attitudes are increasingly favoring more legalization not less so compliance may be way behind but the market is too big to ignore.
MSOS -60% from highs
MJ -72% from highs
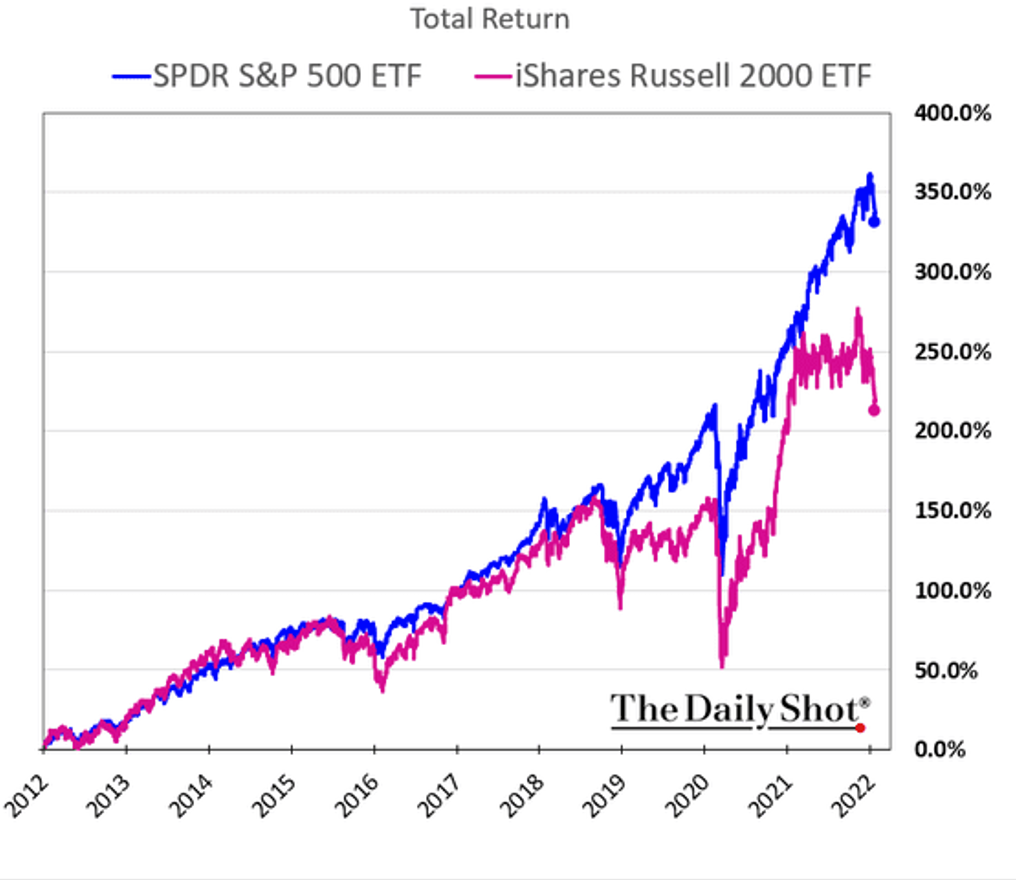
9. Small Cap vs. Large Growth
Over the long-term small caps outperform large caps by healthy margin but the last 10 years has witnessed large cap domination.
Barrons-By Ben Levisohn No matter what you want to call the current run-up, large-cap valuations are high enough that investors shouldn’t expect much over the next decade, according to BofA Securities strategist Jill Carey Hall. At just under 21 times earnings, the large-cap Russell 1000 appears set to return just 1.7% over the next 10 years, based on the historical correlation between valuations and earnings. Small-caps, though, look set to do far better. The small-stock Russell 2000, at 15.5 times forward earnings, would imply an 8.8% annualized return.
The Russell 2000, though up 14% in 2021, still lags the Russell 1000 by about 12 percentage points and looks set to underperform for a fifth consecutive year. Still, it’s only a certain kind of low-quality small-cap that’s had a tough time in 2021, and those companies make up about a quarter of the index. That helps explain why the S&P Small Cap 600, which has just a tenth of its portfolio in non-earners, has gained 26% this year, only a touch behind S&P 500.
The 11 percentage-point gap between the Russell 2000 and the S&P Small Cap 600 is the largest since 2000. That, of course, was the peak of the dot-com bubble, which marked the beginning of a period of strength for small-cap stocks. And while the S&P 600 continued to outpace the Russell 2000 over the next two years, both outperformed the S&P 500. Hall expects something similar in the years ahead.
“And if today’s market environment shares some similarities with ‘99/’00…this could prove to be a strong decade for small caps,” Hall writes.
https://www.barrons.com/articles/stock-market-ark-innovation-bubble-51640880687
The selloff in small caps continued. Here is the 10-year relative performance.
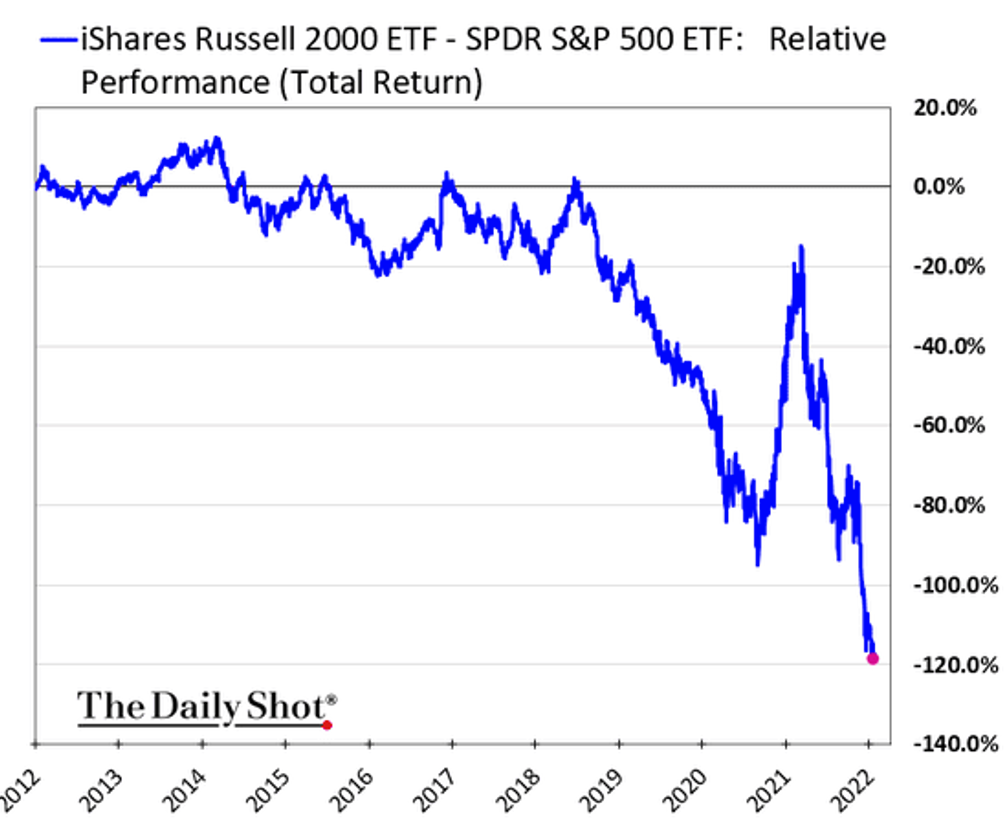
https://dailyshotbrief.com/the-daily-shot-brief-january-21st-2022/
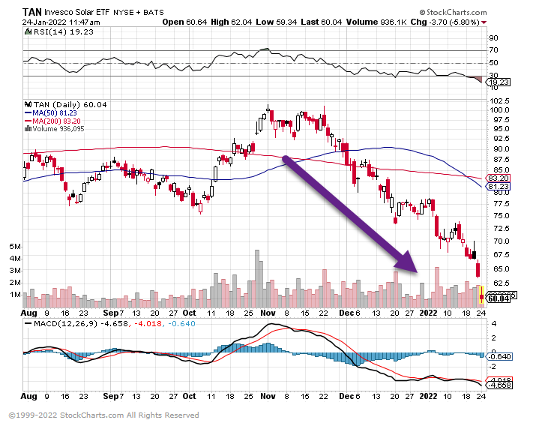
10. Solar Stocks
I am aware that this may be viewed as contradictory to my earlier energy/commodity reversion picks but alternative energy and traditional energy side by side existence is reality for the foreseeable future. TAN the solar ETF has been cut in half from its highs -50% on chart. This business is a regulatory and subsidy based minefield but the cost of solar has plummeted over the last 10 years.
Disclosures
Lansing Street Advisors, LLC is a registered investment advisor with the State of Pennsylvania. You can read more about the Lansing team at www.lansingadv.com.
To the extent that content includes references to securities, those references do not constitute an offer or solicitation to buy, sell or hold such security as information is provided for educational purposes only. Articles should not be considered investment advice and the information contained within should not be relied upon in assessing whether to invest in any securities or asset classes mentioned. Articles have been prepared without regard to the individual financial circumstances and objectives of persons who receive it. Securities discussed may not be suitable for all investors. Please keep in mind that a company’s past financial performance, including the performance of its share price, does not guarantee future results
Material compiled by Lansing is based on publicly available data at the time of compilation. Lansing makes no warranties or representations of any kind relating to the accuracy, completeness or timeliness of the data and shall not have liability for any damages of any kind relating to the use of such data.
Material for market review represents an assessment of the market environment at a specific point in time and is not intended to be forecast of future events or guarantee of future results.
Indices that may be included herein are unmanaged indices and one cannot directly invest in an index. Index returns do not reflect the impact of any management fees, transaction costs or expenses. The index information included herein is for illustrative purposes only.
The trademarks and service marks contained herein are the property of their respective owners.
Lansing Street Advisors is a registered investment adviser. Information presented is for educational purposes only and does not intend to make an offer or solicitation for the sale or purchase of any specific securities, investments, or investment strategies. Investments involve risk and, unless otherwise stated, are not guaranteed. Be sure to first consult with a qualified financial adviser and/or tax professional before implementing any strategy discussed herein. Past performance is not indicative of future performance.
Lansing Street Advisors may discuss and display, charts, graphs, formulas which are not intended to be used by themselves to determine which securities to buy or sell, or when to buy or sell them. Such charts and graphs offer limited information and should not be used on their own to make investment decisions.