Money, Money, Money.
Money, money, money
Must be funny
In the rich man’s world
Money, money, money
Always sunny
In the rich man’s world
Aha
All the things I could do
If I had a little money
It’s a rich man’s world
It’s a rich man’s world

Introduction
I am approaching 25 years in finance as I pen my 21st quarterly letter as a CIO and Advisor. As most of you know I spent 17 years on a stock trading desk prior to my move to the advisor world. This was a blessing beyond compare professionally as I could not have gotten a better education on markets but more importantly on people – especially human interactions with money.
I have witnessed several cycles and crashes as well as endless smaller bouts of speculative madness, but I have never seen so much money sloshing around as today. To reiterate a data point from my last letter, the government stimulus from Covid was 8x 2008 housing crash in a world that was already swimming in cash.
The logical questions are where will all this money allocate? What areas will be goose eggs? What sectors will survive and prosper? Who are the tulips? Who are the fourth industrial revolution long-term winners?
With this amount of money sloshing around the winners and losers become exacerbated.
In a world drenched in comparisons, with humanity stuck on social media contrasting themselves to High School classmates and media stars, let’s try to contrast some stock market data that is useful as opposed to human contrasts that is careless. In past quarterly letters, I have touched on current investments market conditions versus the 1999 tech bubble. The conclusion was that although we had some similarities, we were nowhere close to tech bubble conditions.
The more important thesis is that Americans are facing an investment landscape that they’ve never experienced before – record low interest rates, high stock market valuations, record high private equity valuations and skyrocketing real estate values. The traditional investment vehicles are not cheap and are only reasonably priced visa vi super low interest rates.
In this letter, we will discuss some measures that increasingly look 1999-like versus some macro measures that will prevent a 1999 melt-down but will increasingly be apt to change under current market conditions.
One of my favorite investing books is Where are the Customers’ Yachts by Fred Schwed. The book is a classic and still in print from the original 1940 publishing because the lessons of the book have not changed in over 80 years. Well, here we go again.
What is Starting to Look Like 1999?
Venture Capital:
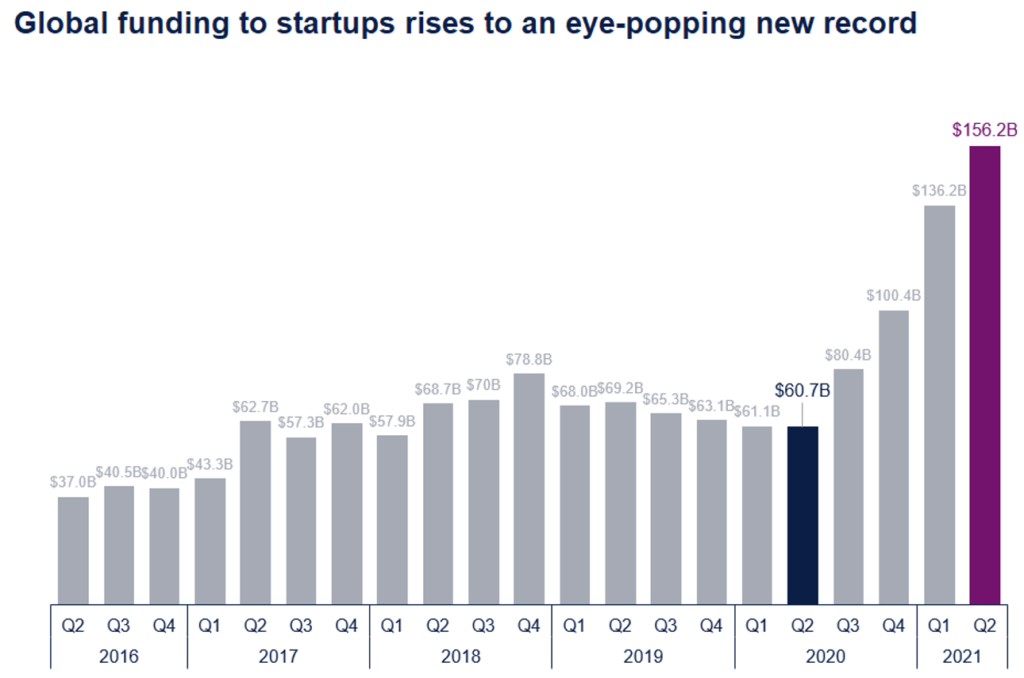
Venture Capital Global funding is eye-popping. It is literally raining money for any entrepreneur with a napkin idea. This is awesome for the world as the fourth industrial revolution is digitizing the business community, re-inventing commerce and forcing companies to adapt to change at higher speeds.
The beauty of free markets is they allow entrepreneurs to take huge risks as more funding arms have become institutionalized and the amount of money available to founders has grown exponentially. The chart below shows almost a triple year over year funding of start-ups from Q2 2020 to Q2 2021.
Yes, the world is awash in liquidity through central banks largesse, but venture trees cannot grow to the sky. As in any market, too much money chasing too few deals results in over-paying for increasingly weaker assets.
Source: Irrelevant Investor Blog–Founders need money, and they’re not having trouble finding it.
The overall US median VC fund size in 2020 was $75 million, the highest since 2008 and a 69% increase from 2019. The $548 billion in U.S. VC assets under management at the end of 2020 included a record $151 billion in dry powder. Startups that were venture-backed in 2020 represented about 2.5 million employees.
Source: Record Year for U.S. Venture Capital Industry Despite Pandemic and Economic Downturn
At the end of 2020, venture already had $151 billion in dry powder – now almost $300 billion in new money was raised first 2 quarters of 2021. My guess is that venture will be sitting on a $1 trillion in cash, burning a hole in its pocket.
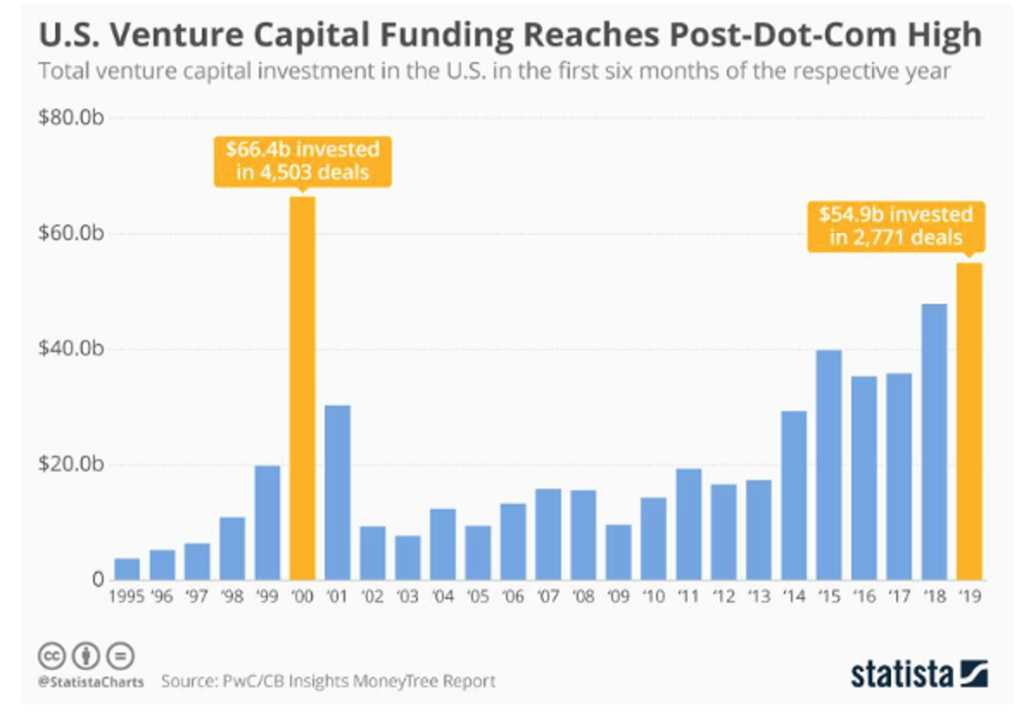
This situation does reflect 1999. The returns following a venture boom coming out of third industrial revolution was an 8-year period of abysmal negative returns from venture funds.
This chart vividly displays the exponential jump in venture capital funding in 2000 following 5 straight double digit return years for the Nasdaq.
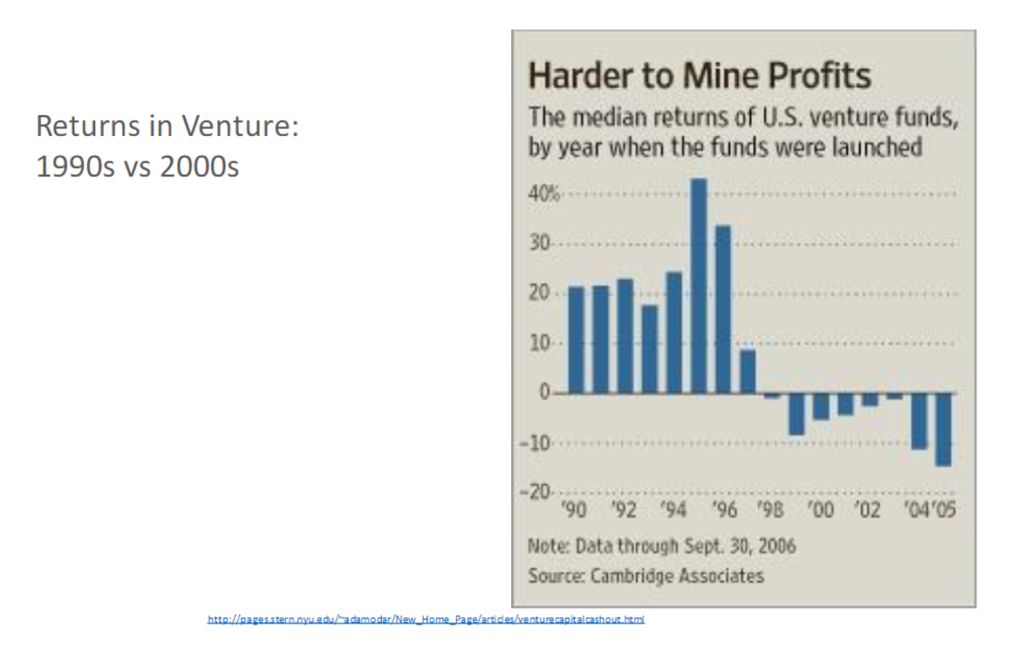
The net result of this boom in fundraising was a total bust in venture capital fund returns. See below venture funds incubated returns from 1998-2005 were negative.
“In prosperous times he is a mighty liberal lender-so liberal that years later unfriendly committees ask him what he was thinking about, and he is unable to remember clearly.”
Fred Schweb, Where Are All the Customers Yachts, describing bankers and lenders. Today it could be venture.
Unprofitable Tech Companies
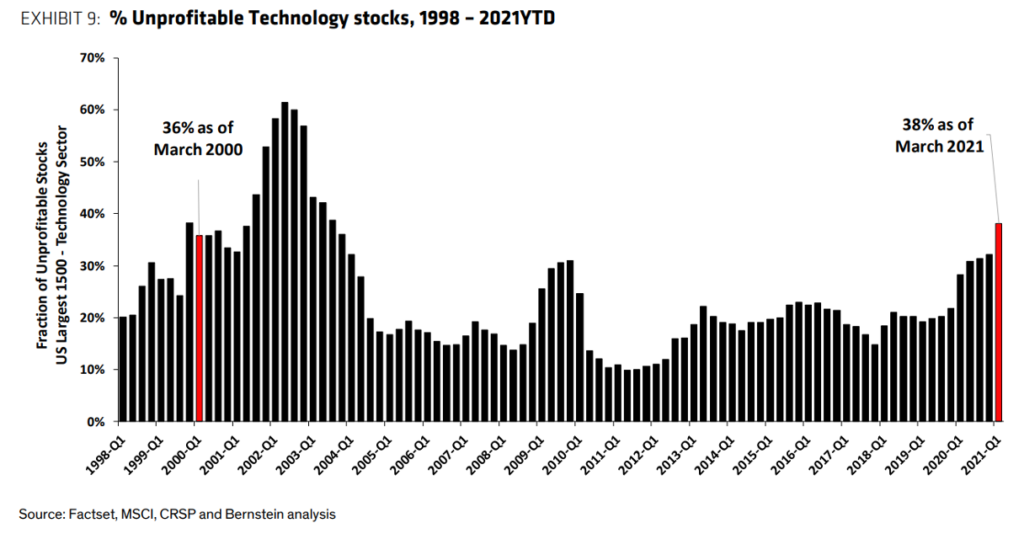
Performance of unprofitable tech companies was off the charts in 2020, returning 65% on an equal weighted basis (92% on a cap weighted basis!), vs. 33% for profitable companies. Tech stocks that don’t make money crushed returns of every other asset class during the internet bubble. History is repeating itself today as the percent of unprofitable tech companies exceeds the 2000 bubble levels and returns of those companies in 2020 was almost a double on cap weighted basis. Also, a tree can’t grow to the sky example. Can these names produce 60-100% returns?
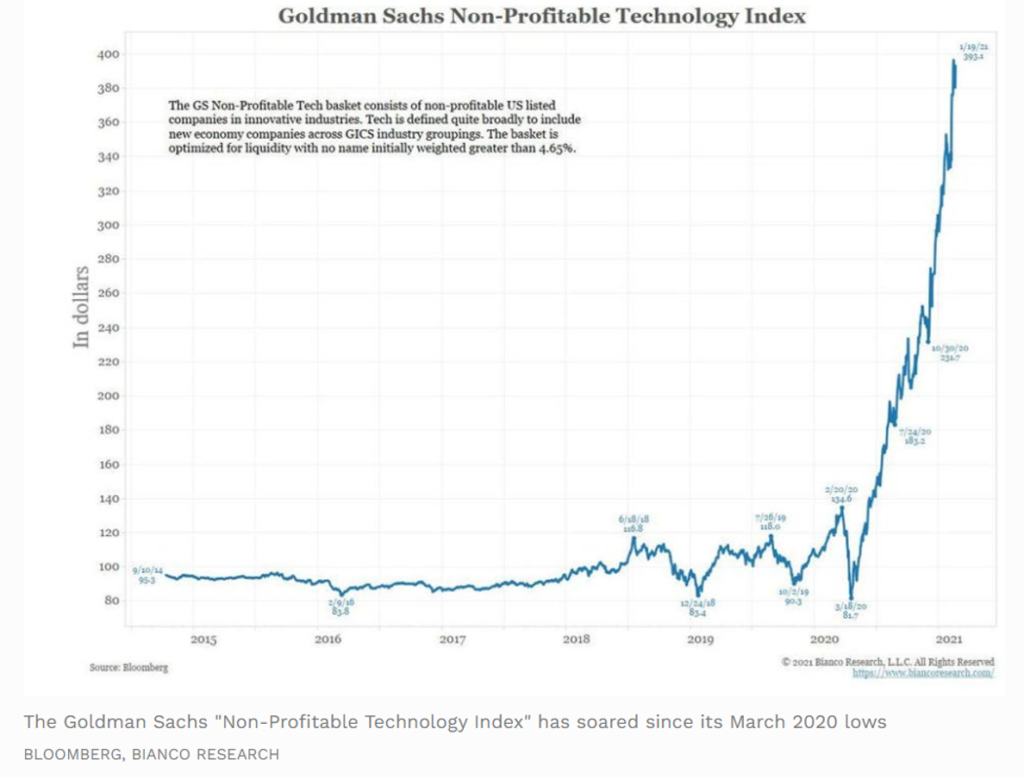
Goldman Sachs has made the comparisons even easier for us by creating the “Goldman Sachs Non-Profitable Technology Index.” The move of these holdings off the Covid 2020 low is the most internet bubble looking chart that I could find.
According to Joel Litman in Forbes, from 2015 to 2020, the index had modest gains. Then, this index showed an exponential spike in 2020 and into 2021, soaring from March 2020 lows. The price of this basket of stocks shows growth of more than 400% from the market bottom to early February. That’s more than 5x greater than the S&P 500 return of 75% during that incredible rebound. Even after the choppiness in recent days, this return dwarfs the tech-heavy Nasdaq composite, which recovered by over 100%.
Goldman Sachs Non-Profitable Technology Stock Index
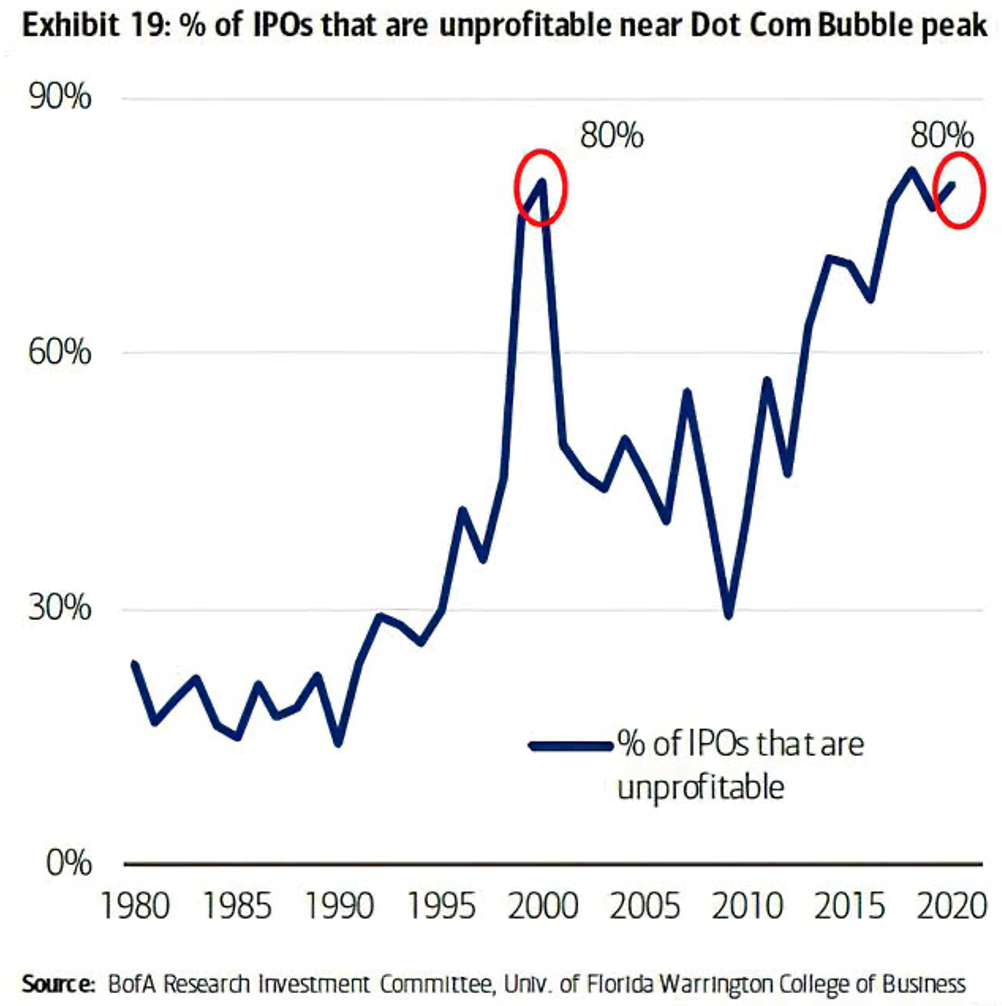
Similarly, the percent of IPOs that are unprofitable in 2020 matched the dot-com bubble. I will leave the argument to people smarter than me that today’s non-profit IPOs are much better companies than the 1999 non-profit offerings, but 80% is a high number. Can it keep going? Can it get to 100%?
The venture boom leads to a non-profit IPO boom that leads to a buildup of stocks trading at over 10x price/sales. The price-to-sales (P/S) ratio is a valuation that compares a company’s stock price to its revenues. It is an indicator of the value that financial markets have placed on each dollar of a company’s sales or revenues. The higher the number, the more expensive the stock market based on fundamentals. As we can see from the GMO Research chart below, we are fast approaching 1999-2000 all-time highs. See after the dot-com crash, the percentage of 10x price/sales companies drops from 30% to below 5% for 15 years.
PERCENT OF U.S. STOCKS TRADING OVER 10X PRICE/SALES
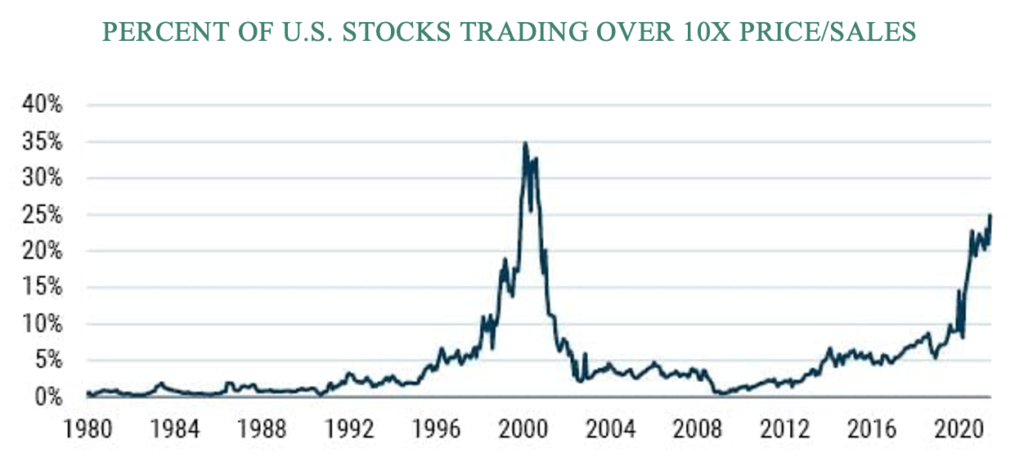
Data from 1/1980-6/2021 | Source: GMO, Compustat
Source: DISPELLING MYTHS IN THE VALUE VS. GROWTH DEBATE
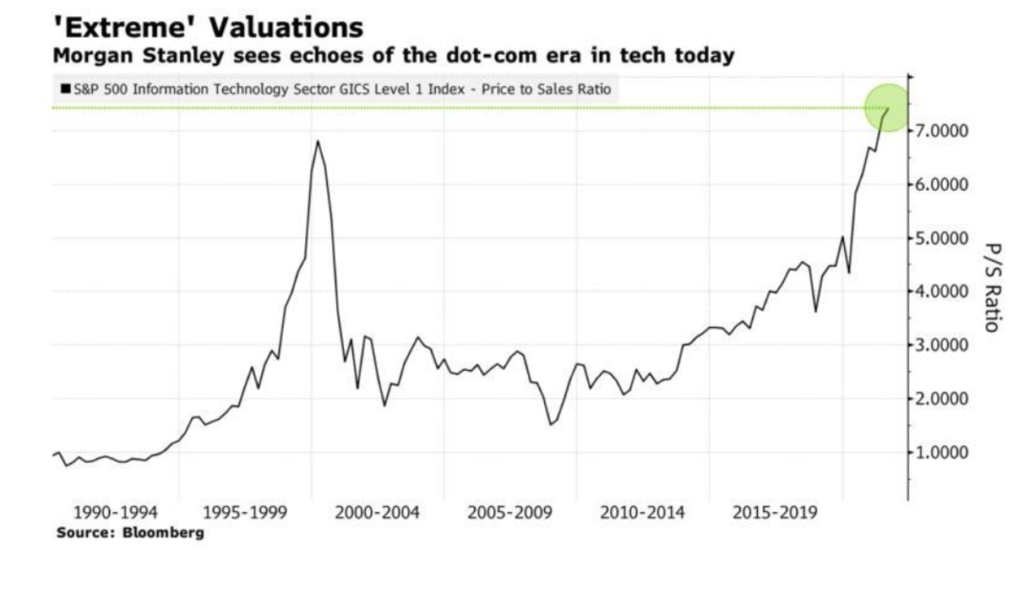
We are close to record highs in stocks trading at 10x sales but in the technology sector alone, we have exceeded the internet bubble record. See Bloomberg chart below showing information technology sector breaking above previous highs in price to sales ratio.
Growth vs. Value stocks
Historically, when growth stocks are expensive and money is plentiful, it would mean value stocks are cheap and unloved. In another close to 1999-2000 measure, value stocks are closing in on their record low valuation versus growth. The last record was set at the top of dot com bubble.
VALUE IS EXTREMELY CHEAP
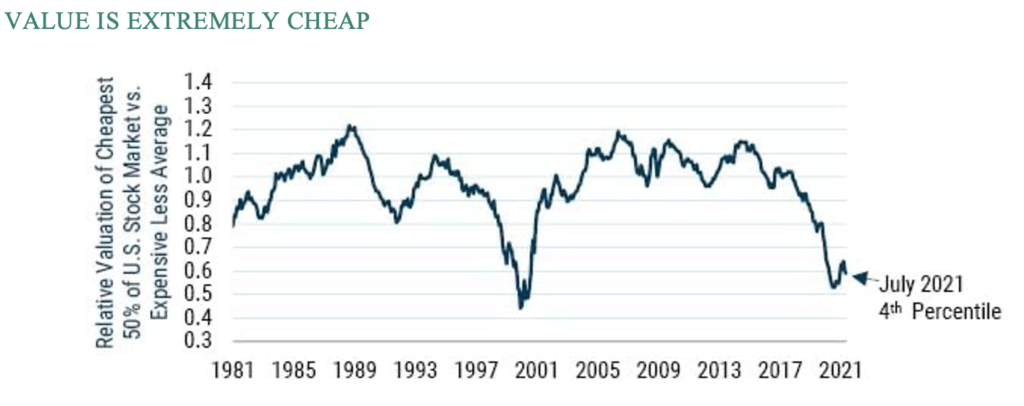
As of 7/31/21 | Source: GMO
Composite Valuation Measure is composed of price/sales, prices/gross profit, price/book, and price/economic book. Value and Growth groups are both sliced over 12 months.
Finally, what is retail speculation now versus 1999? In previous letters I have opined on the notion that until we get the average citizen gambling in the stock market, we will not see internet bubble-like action. The last couple quarterly letters discussed Millennials repeating the mistakes of their parents with new Robinhood stock trading habits mirroring the 1999/2000-day trading craze.
Well, we are in that pool right now. Not only is retail speculating but they are using a trading tool that shrinks their odds of winning to an even lesser chance than straight individual stock trading. Retail investors are now trading stock options at record rates, a game in my opinion, they have zero chance of winning.
Options Record by Retail…Notional Option Value Traded in 2021 is Higher than Stock Market Volume Traded.
WSJ-Nine of 10 of the most-active call-options trading days in history have taken place in 2021, Cboe Global Markets data show. Almost 39 million option contracts have changed hands on an average day this year, up 31% from 2020 and the highest level since the market’s inception in 1973, according to figures from the Options Clearing Corp.
So far this month, single-stock options with a notional value of roughly $6.9 trillion have changed hands, well above the $5.8 trillion in stocks that traded, according to Cboe data through Sept. 22. Notional value is a measure of how much the shares underlying option contracts are worth, a figure that fluctuates with daily moves in the shares.
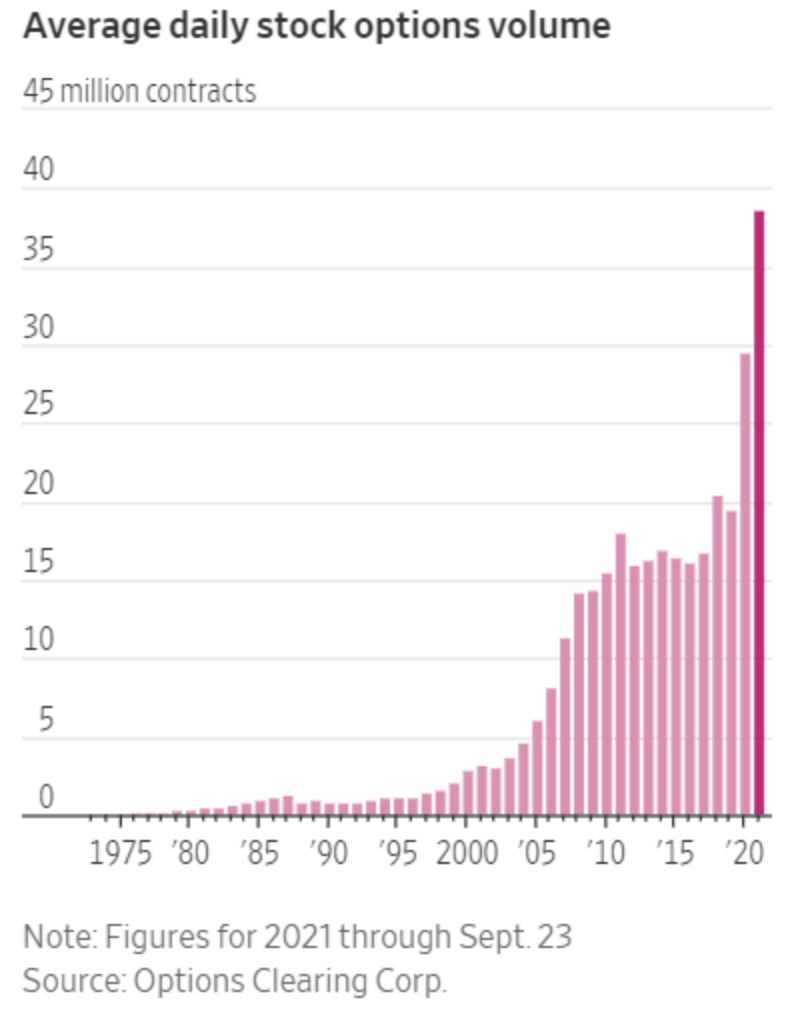
Source: Individuals Embrace Options Trading, Turbocharging Stock Markets By Gunjan Banerji
There is only two ways to make money trading options: be very lucky or have insider information. Considering that luck is not a good way to run an investment portfolio and insider trading will put you in jail, stock option trading for novices is a flat-out loser’s game.
I put options in the letter as extreme example but crypto, meme stocks, day trading, margin borrowing at record levels, Reddit names etc. has put us back in 1999-2000 level of retail investor mania. The question in any mania is duration, how long will the bubble play out? I covered all the liquidity driven areas of the market in my first quarter letter The Day the Music Died.
“It seems the immature mind has a regrettable tendency to believe, as actually true, that which it only hopes to be true.” Fred Schwed Where Are the Customers’ Yachts
Dear Millennials,
Please don’t go all in with options.

What Doesn’t Look Like 1999?
This is where things get complicated, and our crystal ball gets cloudy. You may feel ready to raise cash after reading the first half of this letter, but we have some serious macroeconomic back drops that make 2021 much different than 1999-2000.
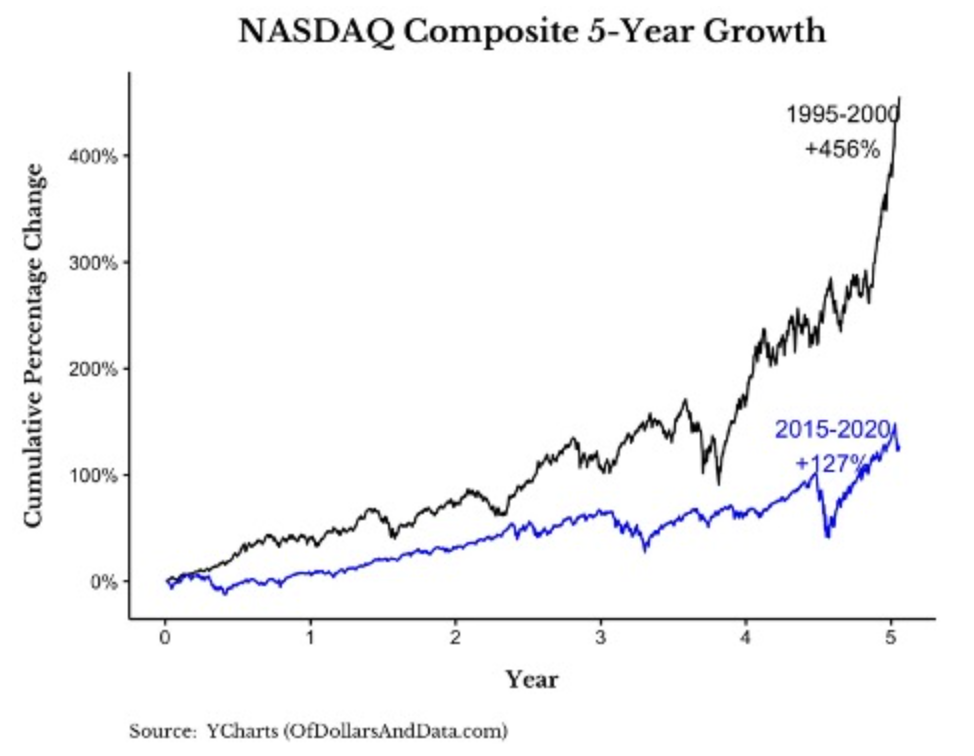
NASDAQ Performance
Even though it feels like the market never goes down, the Nasdaq internet bubble performance dwarfed today’s market by 4x. Today’s market is not in a bubble nearly the size of 1999, the Nasdaq took 15 years to recover its high after 2000 crash. Young investors today have no concept of a true crash as Millennials have only experienced rising stock and real estate markets.
Yes, its ok to say “Holy Shit” when you look at this chart, but the internet bubble was the mother of all speculative bubbles. Funny how you can’t find a non-insider that got rich speculating during the internet boom. Unfortunately, most retail investors went all-in during the last gap up in chart below.
Cash On Balance Sheets
The next big difference between now and 1999 is cash on public company balance sheets, especially tech stock balance sheets. S&P 500 companies are sitting on close to $2 Trillion in cash.
Source: Analysis: Investors look to near $2 trillion corporate cash hoard to buoy stocks
Unlike the previous bubble, tech companies are flush with cash.
Stronger balance sheets are a testament to the underlying strength of their business models. Cash balances at Apple, Microsoft and Alphabet are the largest among non-financial companies in the U.S. Apple and Microsoft even pay quarterly dividends — a big shift from a decade ago, when the thought of a technology company paying a dividend was seen as a sign that growth was slowing.
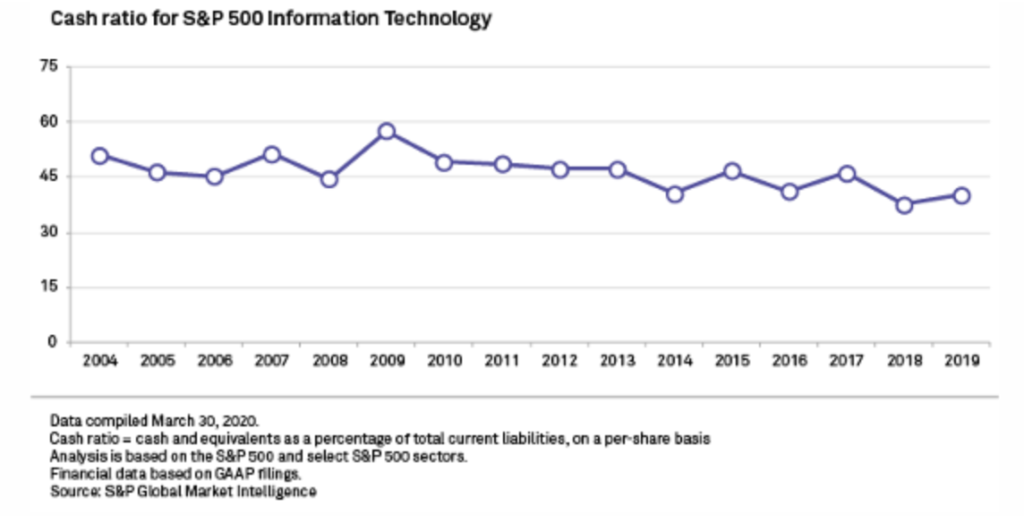
Source: 4 Charts That Show This Tech Boom Is No Dot-Com Bubble – Jody Jonsson, portfolio manager
U.S. citizens forget what this feels like but, believe it or not, at the time of the internet bubble crash, the U.S. government was running a budget surplus. The fact is that the government hasn’t run a budget surplus in 20 years and the annual deficits are growing larger.
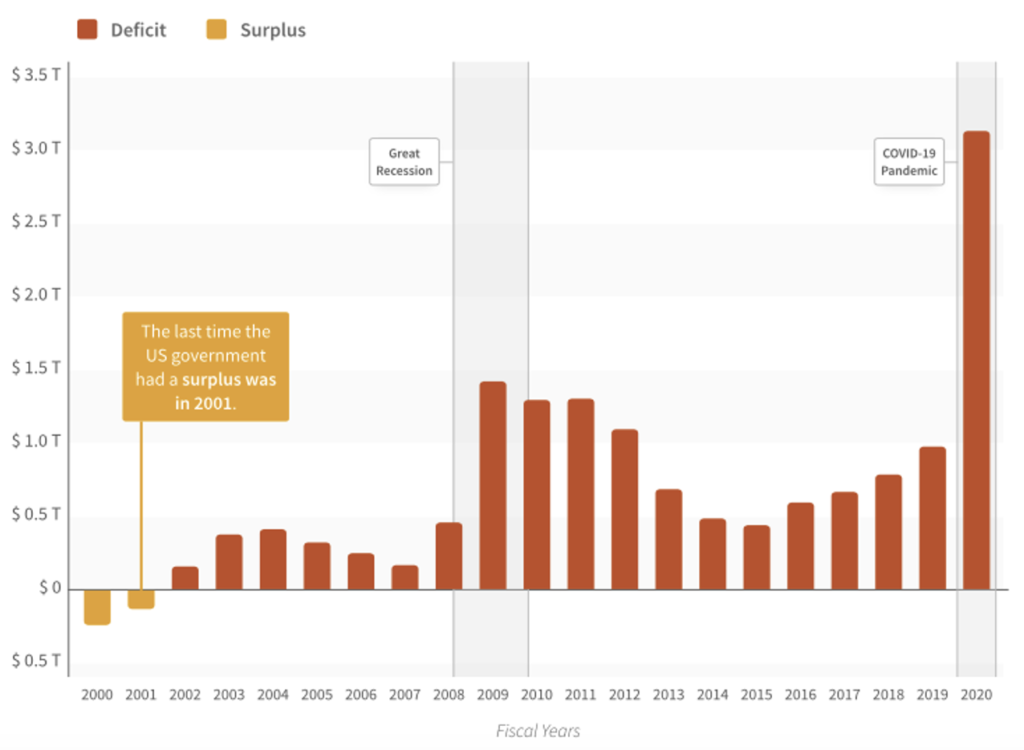
The biggest budget deficits were, of course, around the financial crisis and the COVID pandemic. During the housing collapse, the government spent trillions bailing out the banks and buying up degraded mortgages to clean up the balance sheets. The pandemic featured trillions of dollars in stimulus payments and small business loans. Over the past several years, annual budget deficits steadily grew throughout the year, finishing somewhere between $500 billion to $1 trillion. As the pandemic recession began, the deficit grew quickly and has been steadily and significantly climbing ever since.
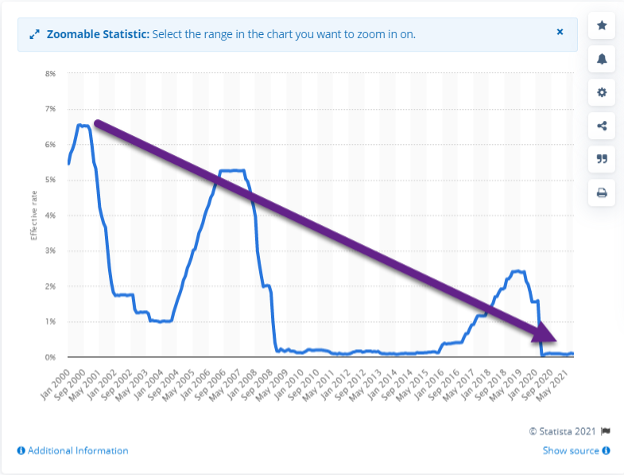
Interest Rates
The other enormous macro difference between 2021 and 2000 is interest rates. The Fed Funds rate when the Nasdaq stock market bubble burst in 2000 was almost 7% versus today at .25 basis points.
This statistic is imperative to valuations across all investment asset classes stocks, real estate, private equity, venture, and bonds. Sticking with the stock theme, growth stocks are dependent on low interest rates in calculating discount rate for earnings, borrowing money from the bond market, and borrowing money for stock buybacks.
Monthly Federal funds effective rate in the United States from January 2000 to August 2021
Household Balance Sheets
Another differentiator from 1999 but especially 2008 crisis is U.S. household debt service ratio. It was 12% of personal income in 1999 and 13.2% record in 2008. We are currently at generational low 8.5% debt payments as a % of personal income while at the same time U.S. household net worth is at record levels exponentially higher than 1999.
Just like running a business, a strong balance sheet can temper tough times and shorten the impact of economic slowdowns, right now U.S. household balance sheets are in stellar condition.
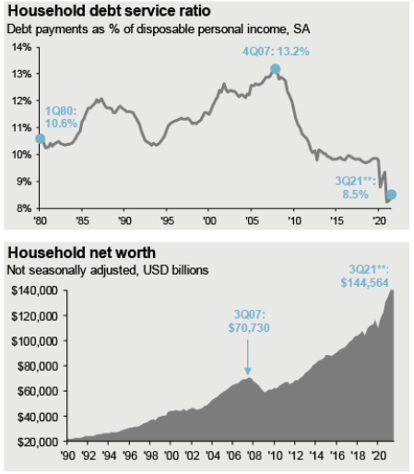
JP Morgan Asset Management https://am.jpmorgan.com/us/en/asset-management/adv/insights/market-insights/guide-to-the-markets/
Conclusion
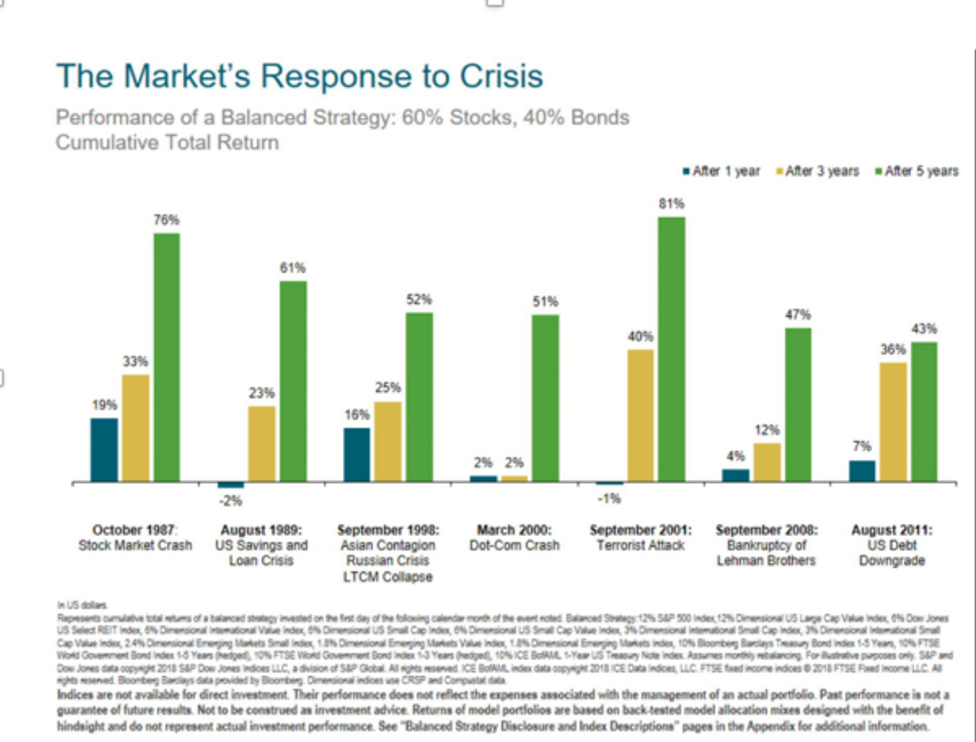
If Covid taught us anything regarding the American economy, it proved how resilient entrepreneurs and workers are when dynamic change happens. And my letters have a running theme of American resilience being second to none. Betting against capitalism has been a loser’s game for centuries.
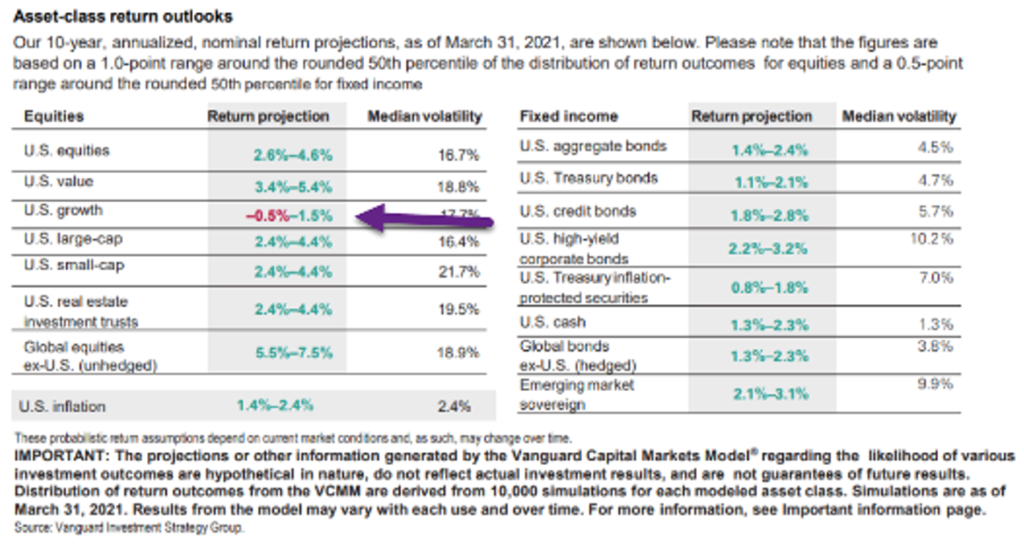
Instead of predicting crashes to sell investments, books, or headlines, let’s step back and look at the math. Below is Vanguard’s capital asset pricing model estimating the next 10 years returns across asset classes. Here is how Investopedia defines the CAPM Model
The model is measuring risk and return through mathematical calculations removing the human emotions that haze our investment thinking. I showed this chart in my last letter but see the purple arrow pointing to U.S. growth stocks 10-year return.
The best way to approach our current investment predicament is to plan for lower returns in the next decade rather than stress over day-to-day volatility or timing the market. This will also require a portfolio allocation that does not look like the last 10 years where “buy the S&P” ruled the day. As you can see on the purple arrow below, the projected return for U.S. growth stocks looks unattractive compared to the 13.5% compound return of the last 10 years.
High Asset Valuations Lead to Lower Expected Returns
Money, Money, Money. Massive amounts of it causes too much money chasing too few assets leaving us with higher valuations that will be much harder to justify if we see rising interest rates. So be prepared for lower total returns over the next 5-10 years and make portfolio adjustments towards a more diversified approach as leaders from last decade may not have a repeat act.
Disclosures
Lansing Street Advisors, LLC is a registered investment advisor with the State of Pennsylvania. You can read more about the Lansing team at www.lansingadv.com.
To the extent that content includes references to securities, those references do not constitute an offer or solicitation to buy, sell or hold such security as information is provided for educational purposes only. Articles should not be considered investment advice and the information contained within should not be relied upon in assessing whether to invest in any securities or asset classes mentioned. Articles have been prepared without regard to the individual financial circumstances and objectives of persons who receive it. Securities discussed may not be suitable for all investors. Please keep in mind that a company’s past financial performance, including the performance of its share price, does not guarantee future results
Material compiled by Lansing is based on publicly available data at the time of compilation. Lansing makes no warranties or representations of any kind relating to the accuracy, completeness or timeliness of the data and shall not have liability for any damages of any kind relating to the use of such data.
Material for market review represents an assessment of the market environment at a specific point in time and is not intended to be forecast of future events or guarantee of future results.
Indices that may be included herein are unmanaged indices and one cannot directly invest in an index. Index returns do not reflect the impact of any management fees, transaction costs or expenses. The index information included herein is for illustrative purposes only.
The trademarks and service marks contained herein are the property of their respective owners.
Lansing Street Advisors is a registered investment adviser. Information presented is for educational purposes only and does not intend to make an offer or solicitation for the sale or purchase of any specific securities, investments, or investment strategies. Investments involve risk and, unless otherwise stated, are not guaranteed. Be sure to first consult with a qualified financial adviser and/or tax professional before implementing any strategy discussed herein. Past performance is not indicative of future performance.
Lansing Street Advisors may discuss and display, charts, graphs, formulas which are not intended to be used by themselves to determine which securities to buy or sell, or when to buy or sell them. Such charts and graphs offer limited information and should not be used on their own to make investment decisions.