1. Defensive Stocks Expensive According to PEG Ratio
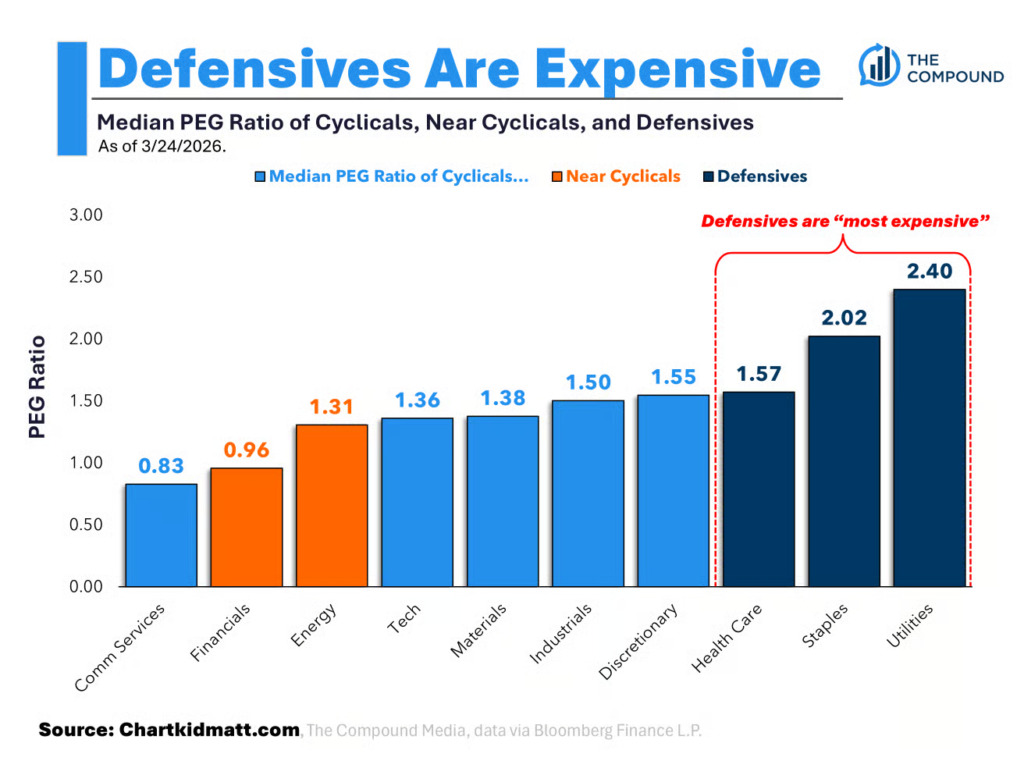
Chart Kid Matt The PEG ratio adjusts “P/E” for “long-term earnings growth”.
- Higher earnings growth relative to P/E will get you a lower PEG
- Lower earnings growth relative to P/E will get you a higher PEG
Earnings growth is assessed on a forward basis based on consensus estimates.
The point is, P/E has little value without understanding how the “E” is expected to change in the future.
Because PEG takes the forward change of the “E” into account, I think it’s a superior fundamental metric to watch than just looking at the P/E.
So in today’s chart, I took the Russell 3000 constituents with available data and plotted the median PEG ratio by sector.
I want to see where the “cheap” and “expensive” stocks are based on this metric.
Here it is, sorted by Cyclicals, Near Cyclicals, and Defensives:
Remember, a higher PEG ratio means a “higher valuation.”
2. Price Increases Shipping, Fertilizer, and Chemicals-Ed Elson
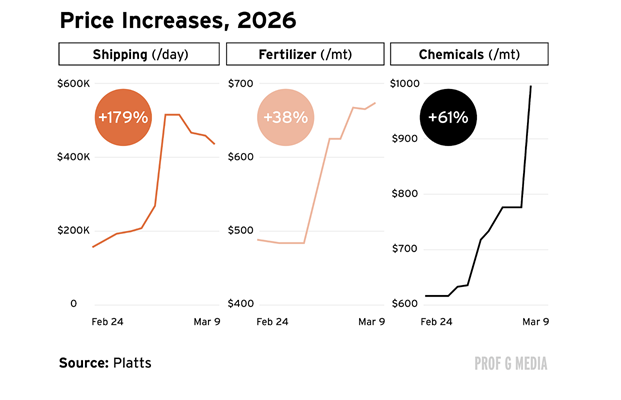
Prof G Markets
3. Gulf Share of World Production-Barrons
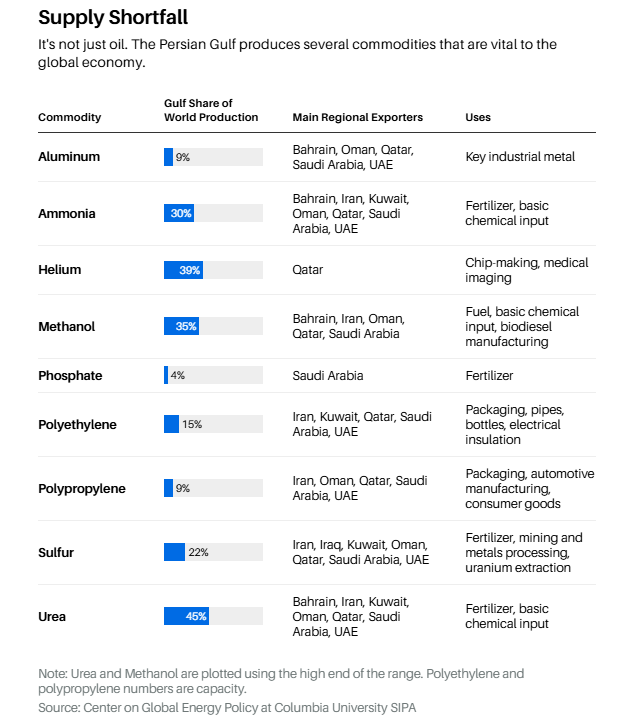
Barron’s
4. Prices Since Start of Iran War
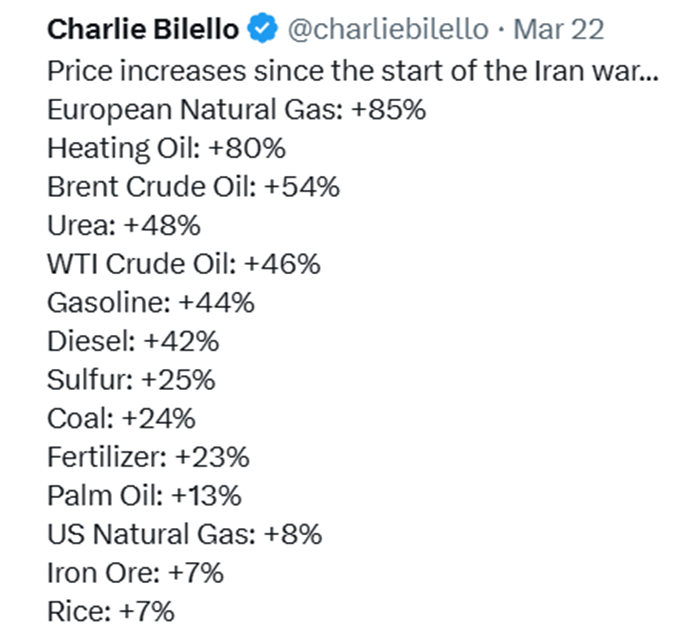
@Charlie Bilello
5. Investors Selling Consumer Discretionary Stocks Due to Higher Inflation….XLY -10% …Close Below 200-Day
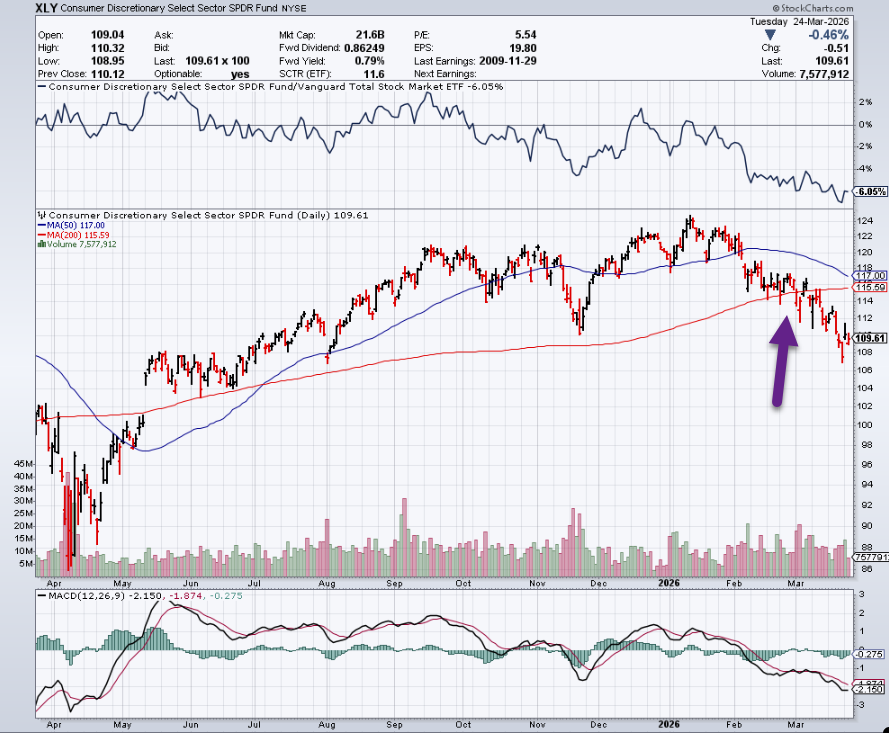
StockCharts
6. Traders placed $580mn in oil bets ahead of Donald Trump’s social media post on Iran talks Thousands of Brent and WTI contracts changed hands 15 minutes before president’s message on Truth Social-FT
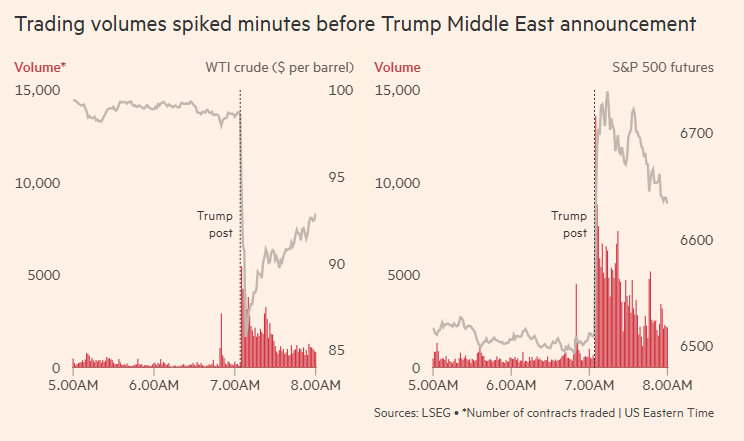
Financial Times
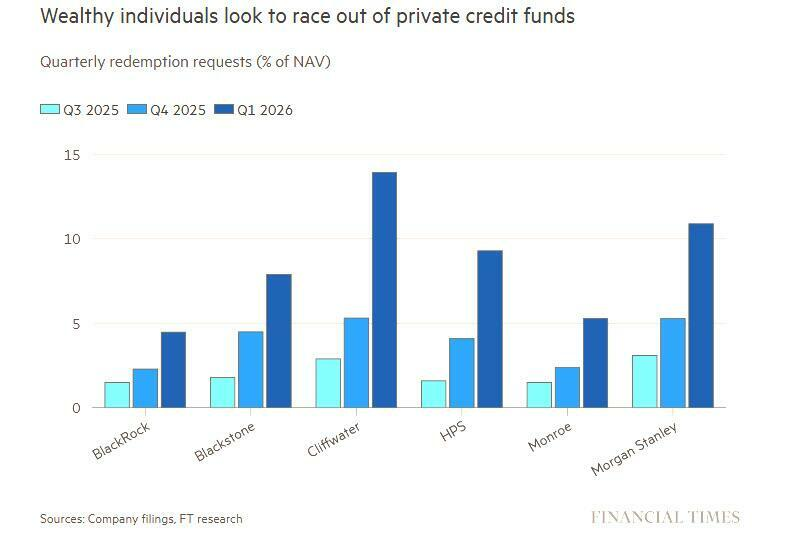
7. Summary of Withdraw Requests from Private Equity Credit Funds
8. INDIA Highest AI Adoption Rate
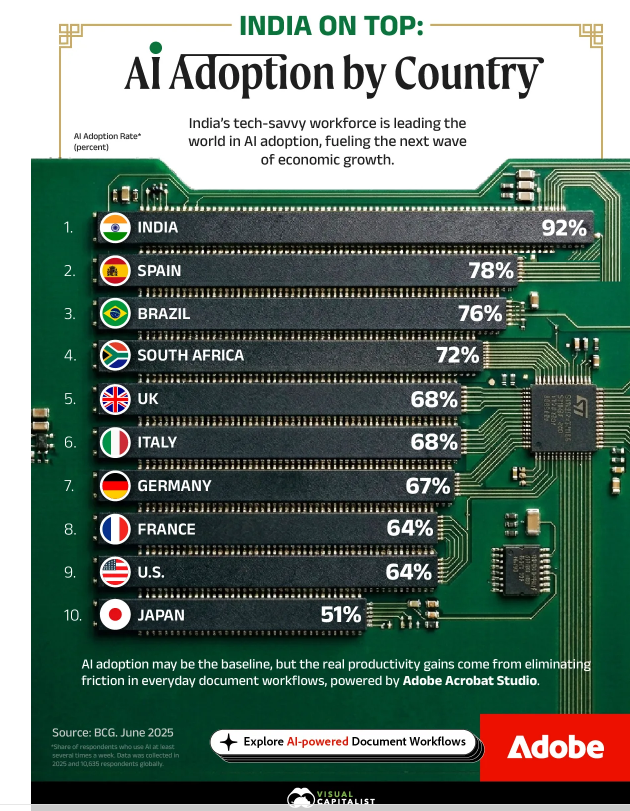
Visual Capitalist
9. Americans Large House vs. Small House
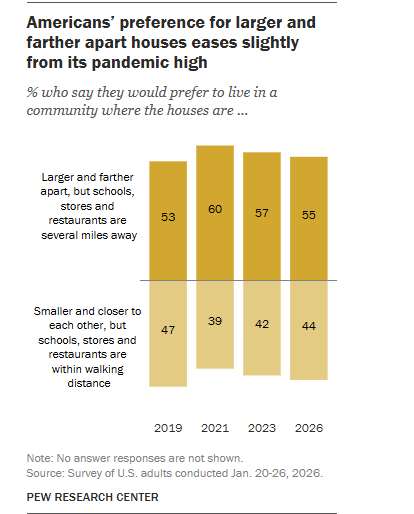
Pew Research Center
10. Look for Green Flags Not Red Flags
We were taught to look out for red flags. Little signs that something is wrong, that we should be careful or even turn around.
Don’t let that distract you from being on the lookout for green flags.
We might need encouragement to leap forward. If you look for the green flags, you’re more likely to find them.