1. GOOGL +87% vs. NVDA +28% One Year
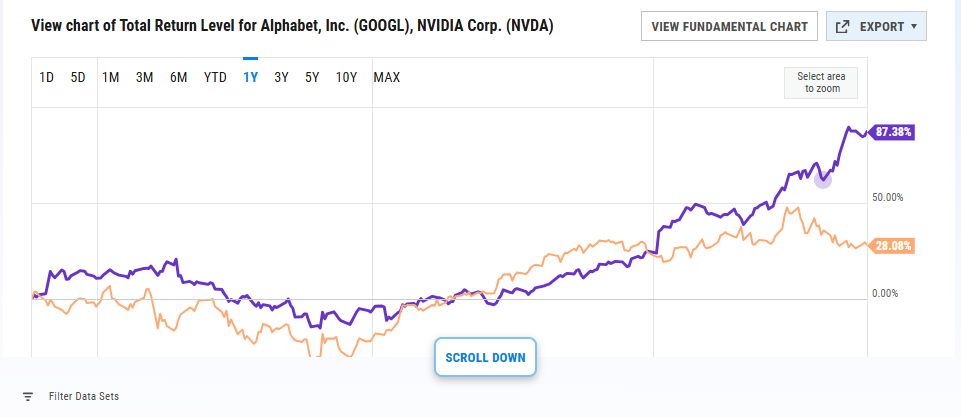
YCharts
2. Gold Now Outperforming S&P 500 for 30 Years
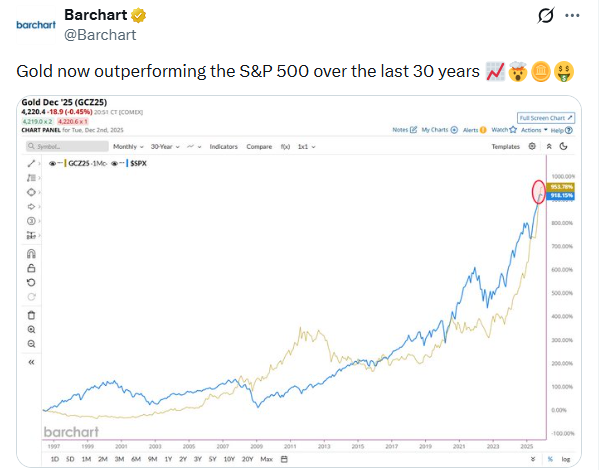
Barchart
3. Retail Investors Buying Gold ETF
Retail and GLD
Retail has bought as much GLD in 2025 as in the previous 5 years.
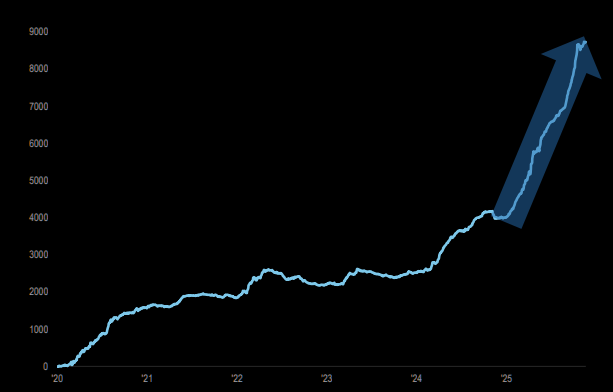
ZeroHedge
4. Open AI vs. Historical Young Start Up Cash Burners
Jim Reid Deutsche Bank On the subject of ChatGPT, it’s been eye-opening to read of the predicted losses that OpenAI will likely experience in the next few years. Based on a Wall Street Journal report, which cited company projections provided to investors over the summer, OpenAI forecasts revenue of $345 billion between 2024 and 2029. Assuming this is all cash, we then calculate $488bn of spending, mainly to pay for access to compute, to arrive at their projected cumulative free cash flow of $143bn. And that was before the most recent announcements of $1.4 trillion in data centre commitments. A broker has more recently said the cash burn could exceed $200bn by 2030.
I thought it would be interesting to look at the largest cumulative losses in history from a young company or a start-up before they turned in a profit. So I asked ChatGPT to give me a table of these companies, detailing the total losses and over which years. We used this to create today’s CoTD. We added in OpenAI’s expected cash burn and also included its rival Anthropic, also using data from the Journal. I double-checked the historic numbers against Bloomberg data and they were broadly in line.
ChatGPT also pointed out that some companies had reported larger annual losses, citing AOL Time Warner’s $99 billion loss in 2002 and a similar size loss for AIG in 2008. Meanwhile, Fannie Mae and Freddie Mac lost $77bn and $59bn respectively within only three quarters when the GFC struck. However, these were well established companies with long track records of profitability before huge troubles hit.

5. Mag 7 Outperforms QQQ and SPY 9 of Last 10 Years
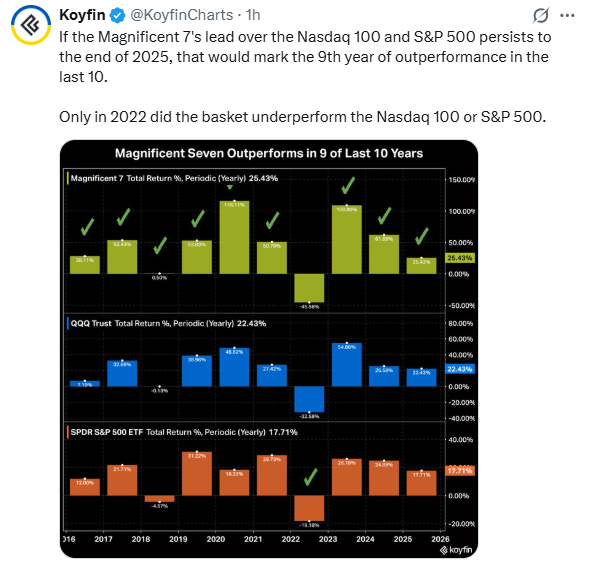
Koyfin
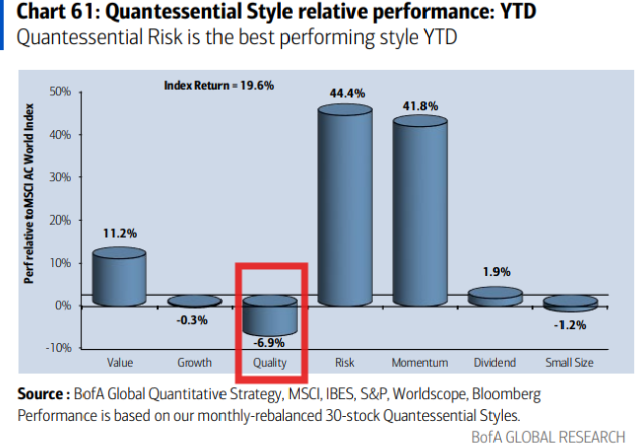
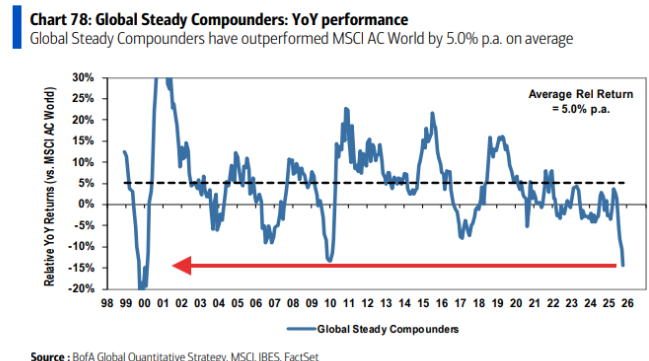
6. Quality Stock Factor Underperforming 2025
Quality Underperformance…BofA noted, Globally, the Quality style has underperformed by 5.5% YTD, and the Global Steady Compounders have experienced the worst 12-month relative return in 25 years. 3 reasons stand out. Firstly, the global earnings cycle is improving, and earnings stable Quality stocks tend to lag in upturns. Secondly, the Risk style – almost the opposite of Quality – has had one of the best years on record. Thirdly, a few themes have driven market performance this year (including AI, Defense, Gold, Rare Earth, Nuclear Energy, and Quantum Computing) and these stocks have a high average beta (1.28).
Zachary Goldberg-Jefferies
7. American Eagle Stock One Tick from New Highs
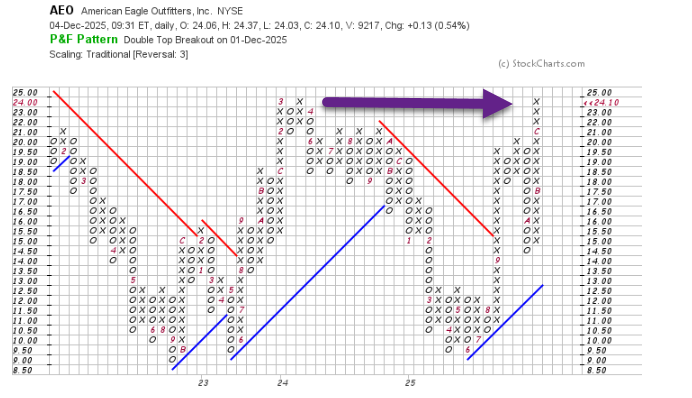
StockCharts
8. Japanese Government Bond Yields Highest in 20 Years
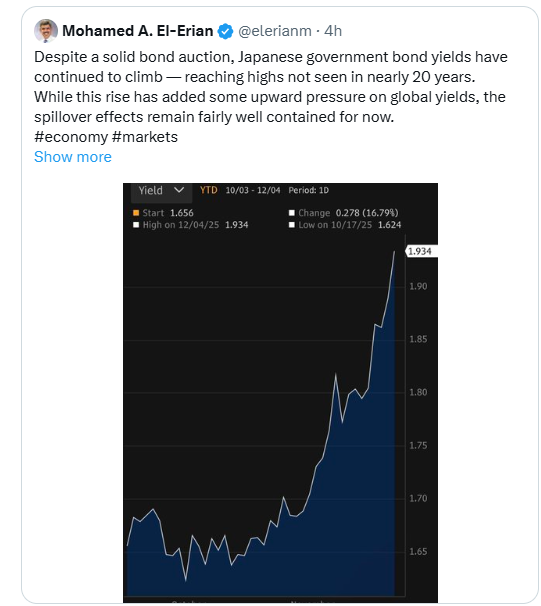
Mohamed A. El-Erian
9. International Stocks on Track for First Outperformance vs. U.S. in 16 Years
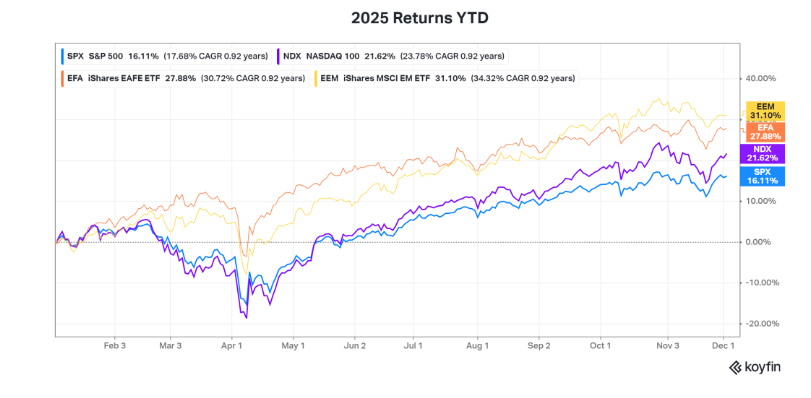
Novel Investor
10. Facts from The Idea Farm
Investing
If you randomly picked a trading day for the Dow Jones Industrial Average between 1930-2020, there is over a 95% chance that the Dow would close lower on some trading day in the future. That means that roughly 1 in 20 trading days would provide you with an absolute bargain. The other 19 would give you the feeling of buyer’s remorse at some point in the future. Link
More than 10 funds will distribute at least 25% in capital gains this year. Link
Since the 1990s, the World Portfolio has grown from 75% to over 200% of world GDP. Link
Of the largest 10 stocks in the S&P 500 Index in 1985, none are still in the top 10. Link
The Thiel Fellowship has a 5.9% Unicorn hit rate. Link
Just 3% of companies generated all the shareholder wealth in the US stock market from 1926-2022. Source: Bessembinder
If you break down the distribution of cumulative returns for stocks in the S&P 500 for the past 25 years:
- The median/arithmetic return was 59%/452%.
- The average return has been greater than the median for The S&P 500’s constituents in 20 out of the past 24 years. Source: S&P Dow Jones Indices
In 1812, financial stocks—banks and insurance companies—constituted an estimated 71% of total U.S. stock-market capitalization. No other sector even amounted to 14%. Link
Alternative Investing
There are more private equity funds than McDonald’s restaurants in the world. Link
Nearly half of gold production is used for jewelry. Link
39% of U.S. land area is used by farms, totaling 876 million acres of farmland. Link
On Jan. 1, 2015, there were 1,345 alternative mutual funds in existence. Only 341 still existed on June 30, 2025 – a 75% mortality rate. Link
In 2021 alone, 478 (30.7%) of all U.S. unicorns hit the $1B mark. Link
Most unicorns exit after a median (average) of 8 (9) years, counting from founding. “Exit” means going public, acquisition, or liquidation/bankruptcy. Link
https://news.theideafarm.com/p/50-facts-from-2h-2025